It’s a hackneyed phrase, but true: A picture’s worth a thousand words. So it is with satellite imagery. Like most pilots, a check of satellite views is among the first steps in my preflight weather briefings. There’s a lot of information there, and much of it is fairly intuitive. Even so, there are strengths and limitations.
The most common images are those from the GOES (Geostationary Operational Environmental Satellite) series. GOES satellites rotate at the same rate Earth does, so they remain over fixed positions in their 22,300-mile-high orbits. For maximum coverage of the hemisphere, there are two such satellites—GOES-13 and GOES-15—which are stationed along the equator at 75 and 135 degrees West, respectively. The sounders aboard these satellites are tuned to various wavelengths, which correspond to the channels providing the three most common sources of information.
Visible
As the name implies, the visible channel provides imagery in the visible spectrum. It’s similar to what you might see if you were an astronaut looking down on Earth.
The good: Visible imagery is very good at showing reflected light. This means that the higher and thicker the clouds, the brighter they will appear. Well-developed thunderstorm clouds show up very well. Visible imagery also can clearly show the leading edges and boundaries of frontal systems, and make identification of a number of different cloud types possible—such as fair-weather cumulus, stratus, cloud streets, and clouds associated with mountain-wave activity.
The not-so-good: If skies are clear and snow is on the ground, this can fool the unwary into thinking low clouds are present. Look for river and stream patterns to confirm the presence of snow. Also, higher cloud shields and bands block the view of any lower cloud layers. Another drawback—and it’s a big one—is that visible imagery is dependent on sunlight, meaning that the times around sunrise and sunset will give less definitive views of clouds. And if it’s night, you’re completely out of luck. The picture will be totally dark.
Infrared
The infrared channel is keyed to temperature. The colder the clouds, the brighter the returns, which are shown with color contours to help identify the coldest cloud tops. Colder surfaces are given the brightest colors, and warmer surfaces are given darker colors.
The good: Because temperatures decrease with altitude, we can infer that the highest clouds and the most severe thunderstorms will have the coldest tops. These are easily identified on an infrared image. In the absence of visible imagery at night, infrared is a fairly good stand-in.
The not-so-good: If cold clouds happen to be in thin layers, and Earth’s surface is cold, then some of that terrestrial radiation can pass through those thin cloud layers. The satellite averages out the radiation from the cloud tops and the ground, and the result is a picture that can show cloud tops warmer and lower than they really are. And while infrared is nice to have at night, it does a lousy job of detecting low clouds and fog because the radiating temperatures of any low clouds can be the same as those of the nearby ground.
Water vapor
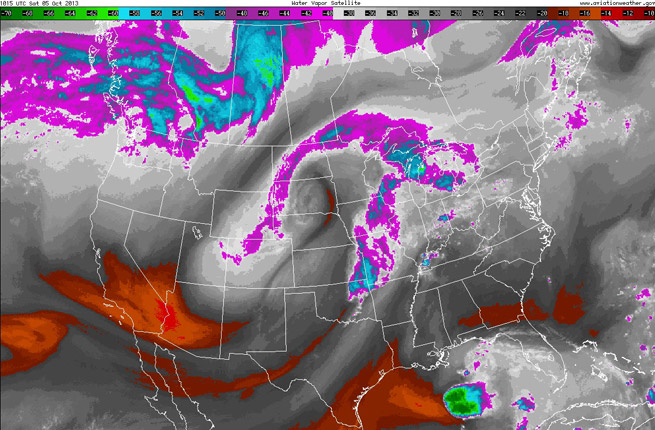
The water vapor channel detects the emission and absorption of Earth’s emitted radiation by water vapor—which, to get technical about it, happens right around the 6.7-micron wavelength. The channel shows water vapor in the atmosphere with shades of white or gray; drier air appears as black areas.
The good: Day or night, the water vapor channel shows moisture distribution patterns associated with fronts and low pressure. In animated views, it’s easy to see the progress of large-scale weather events, so water vapor imagery is helpful in observing and forecasting them.
The not-so-good: Because the satellite looks for water vapor’s quite narrow wavelength, any high-altitude concentrations will block out the signatures of any lower-level concentrations—or clouds, for that matter. You could have a situation where a black zone of drier air appears on water vapor imagery, but an infrared or visible view shows clouds in the same area. Yes, thanks to gravity, water vapor concentrations drop with altitude, but it’s still there nonetheless—just in lower concentrations. For this reason, water vapor imagery is best at depicting water vapor in the middle altitudes, say from 10,000 to 25,000 feet.
Playing on each image’s strengths, it’s best to use satellite views in combination. Use visible imagery to determine if clouds are thick or thin. Use infrared to tell how high they are. Use water vapor to watch for system movements and the rise and fall of moisture inflows and outflows.
Email [email protected]