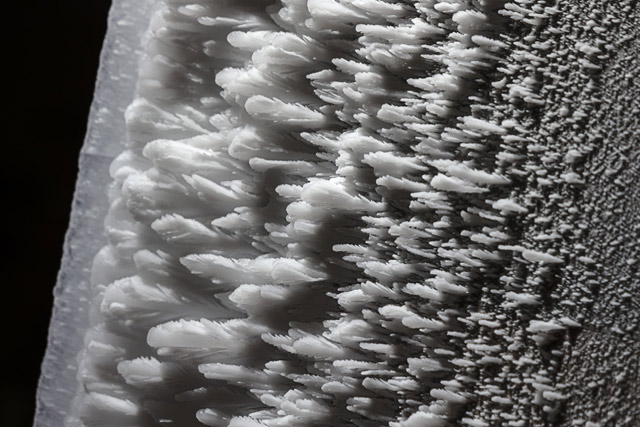
Large-droplet icing forms on an airfoil leading edge. Featherlike growths begin aft of the leading edge (at left), because large droplets run back before freezing.
Photography by Mike Fizer
Winter’s the time that always brings our attention to the well-known threats posed by icing, but it’s also a good time to review the regulatory and research news relating to icing. This year, there’s a lot to report.
The Roselawn accident
A little more than 20 years ago, on October 31, 1994, an ATR–72 flying as American Eagle Flight 4184 crashed near Roselawn, Indiana. It was a landmark event, and a turning point in our understanding of the icing environment. The National Transportation Safety Board’s report on the accident is an extensive compilation of data, and the entire sad document can be viewed online. Just Google “NTSB/AAR 96/01.” But for a quick review, here is very foreshortened version of the events leading up to the crash:
NTSB recommendations
A slew of recommendations came from the NTSB accident report. Yes, the airplane had ice protection and was certified for flight into known icing (FIKI); and yes, the crew had the ice protection gear in operation. But it turns out that the icing conditions that felled Flight 4184 were poorly defined, let alone understood. To be blunt, we didn’t know much at all about the kind of icing phenomenon that contributed to the crash. And because we didn’t know about it, the FAA hadn’t developed the certification rules to ensure that airplanes could be protected against it. The ATR–72—like other FIKI-approved types—might have been certified for flight into known icing, but it wasn’t certified to fly in the conditions it encountered that day over Roselawn: large-droplet icing conditions of the kind found in freezing rain or freezing drizzle.
These conditions are especially dangerous because the larger the supercooled drops, the farther back it will run along the wing surfaces. When this runback ultimately freezes, it can create a ridge of ice that interferes with the flow of air over the ailerons—which is exactly what happened in the ATR crash. Normally, ailerons self-center in flight, and fly in trail with the wing. But in tests conducted after the Roselawn crash, it was learned that ridges of runback ice can cause aileron hinge moment reversals that can make the ATR’s ailerons suddenly deflect to their maximum positions.
Sure, there were piloting errors that contributed to the crash, and the NTSB recommendations addressed them. But when it came to icing issues the NTSB focused on what came to be known as supercooled large droplet (SLD) or supercooled drizzle droplet (SCDD) icing.
The NTSB recommended that the FAA expand the icing certification envelopes to include freezing rain, freezing drizzle, and mixed water/ice crystal conditions. It also recommended that the FAA and the National Oceanic and Atmospheric Administration (NOAA) sponsor the development of methods to produce short-range forecasts (“nowcasts”) that define specific locations of freezing drizzle and freezing rain—and that the forecasts have valid times of two hours or less.
The envelopes, please
Finally, in November 2014, the FAA published new icing certification rules and the new icing envelopes the NTSB had asked for. It’s in Volume 79, No. 213 of the Federal Register, dated November 4, 2014. It was a long, detailed effort, but as of January 2015 manufacturers of Transport category airplanes seeking FIKI certification must test their aircraft in the icing conditions as defined not just by the two original envelopes (one for rime ice, one for clear ice) in Part 25, Appendix C—but by two more (for freezing rain and freezing drizzle) in the new Appendix O, and an additional envelope covering the convective cloud ice crystal environment. The latter is aimed at preventing internal turbine-engine icing caused by the ingestion of ice crystals and their subsequent melting and refreezing on rotating vanes, stators, and other components.
Manufacturers of lighter aircraft certified under FAR Part 23 are not affected by the new rules—yet. The rules only cover new, yet-to-be designed airplanes, certified under Transport category, FAR Part 25 rules, and with maximum takeoff weights less than 60,000 pounds and/or flight controls that produce motions or forces about their hinge lines. Airplanes with MTOWs higher than 60,000 pounds have not experienced accidents or incidents associated with flight in SLD, the FAA said.
While some believed the same rules should apply retroactively to all Part 23 airplanes, including those FIKI-certified with deice boots, the NTSB rejected this approach, saying that a retroactive application would change the certification basis of operational airplanes to correct an unsafe condition—something that is generally done by airworthiness directive (AD). Even so, the FAA said it has chartered an aviation rulemaking committee (ARC), and “may pursue additional rulemaking for Part 23 airplanes,” according to comments in the Federal Register.
Forecasting for SLD
The meteorological research community has been hard at work identifying large-droplet and mixed water/ice crystal environments. One big project—the Current Icing Potential (CIP) and Forecast Icing Potential (FIP) products—has already borne fruit, and is now available and operational (as information supplemental to icing Airmets) on the Aviation Weather Center’s Aviation Digital Data Service (ADDS) website. Recent improvements to the model feeding the CIP and FIP include a denser data grid. Where data once was gathered in 20-square-kilometer grids and every 1,000 vertical feet, it’s now based on data points in 13-square-kilometer grids every 500 vertical feet. And the CIP has been identifying areas of potential SLD icing for several years now. “The probability of detection is very high—about 90 percent—with the CIP,” said Marcia Politovich, deputy director of science for aviation applications programs at the National Center for Atmospheric Research (NCAR). “But when it comes to forecasting freezing rain and freezing drizzle, both in and out of cloud, that’s a different story. It’s difficult enough to forecast freezing rain and freezing drizzle at the surface, let alone at altitude.”
Hope is on the horizon, but it will take time. NCAR is working on models that will predict icing conditions for real-time operations. Using satellite data with information from the new, dual-polarization Nexrad weather radars, which are able to distinguish different droplet sizes, NCAR hopes its scientists will be able to tell if a suspect area is comprised of above-freezing liquid water, supercooled icing droplets, SLD icing, graupel (soft hail or snow pellets), or mixed water and ice crystals. Another NCAR program is testing a combination of satellite, computer-model, and three-dimensional radar mosaics to learn of areas with high ice/water contents in convective conditions. And NASA is trying out its version of an ice-detection program—the NASA Icing Remote Sensing System (NIRS)—using radar, ceilometer, and microwave radiometer data.
Roselawn continues to teach us all powerful lessons. That goes double for those who fly on instruments in the colder months, and who continue to test their luck. Experience flying in icing environments does not grant us continued success—even if we’re fortunate enough to fly airplanes with FIKI approval. The same rules for safe winter flying hold true. Avoid potential icing conditions as a matter of course, and escape them immediately should you inadvertently encounter them. A climb or descent of 2,000 to 3,000 feet may do it, as would a 180-degree turn—or a prompt precautionary landing. Anything but press on.
The most experienced may reassure themselves by recalling their many previous encounters with ice. “I’ll be OK once I climb through this layer,” some might tell themselves. Or, “it’s bound to be warmer if I descend.” Or, “I’ll be out of this soon.” Just remember the old saying: If you hang around a barber shop long enough, you’ll get a haircut.
Warning signs
Icing researchers and certification test flights use a number of methods to replicate icing conditions. In each case, the goal is to produce the combinations of arcane variables such as liquid water content, droplet diameters, and temperatures that match each icing condition. Simulated icing tests of airplane models or their components are conducted using predictive computer models, such as the LEWICE (the LEWis ICE accretion program) model developed by the experts at the NASA Glenn Research Center (formerly called the NASA Lewis Center) in Cleveland, Ohio. Other tests are performed in icing wind tunnels—such as the one at the NASA Glenn facility. Flying a test airplane behind a spray-bar-equipped icing tanker is an additional tactic. Ice shapes made of wood or composite materials are affixed to wing leading edges for inflight testing. Finally, candidate airplanes are flown in natural icing conditions to obtain real-world results.
But how can we tell if we’re flying in SLD conditions? We don’t have sophisticated testing gear aboard, so we have to use our senses. Be on the lookout for:
• Unusually extensive airframe accumulations, especially in areas where ice normally doesn’t accrete
• Accumulations at the edges of unheated or unprotected cockpit side windows
• A ridge of ice on the wing, aft of boots or heated leading edge panels
• Visible rain or droplets that splash or splatter on impact at temperatures below 0 degrees Celsius
• On twins, large accretions on propeller spinners
• Airspeed losses
• Unusual pitch attitudes, trim positions or movements (which may not be detected if an autopilot is engaged)
• Unusual feedback through the controls (which may not be detected if an autopilot is engaged)
• Warm fronts. SLD often forms when snow falls into a warmer air mass beneath the frontal boundary, creating rain and mixed icing. (And SLD-bearing warm fronts are most often found over the Great Lakes, the Pacific Northwest, and New England.)
• Cloud layers. SLD often forms from the freezing level to the surface in layers anywhere from 3,000 to 7,000 feet thick. SLD conditions are mostly found below 12,000 feet
Email [email protected]
How are your IFR flying skills?
27.4% I’m not current.
14.6% I don’t have my instrument rating but plan to earn it.
10.6% I’m current but don’t feel proficient.
29.4% I am current and proficient.
17.8% I intend to stay VFR.
Video Extra: Take an in-depth tour of the NASA Glenn Research Center.
The weather at the destination—Chicago’s O’Hare Airport—was sky partially obscured, measured ceiling 1,100 feet broken, 2,500 feet overcast, visibility 2 1/2 miles in moderate rain and fog, with a temperature and dew point of 44 and 43 degrees Fahrenheit, respectively. Airmets were out for icing from the freezing level (2,000 to 5,000 feet) to 19,000 feet, and for occasional moderate turbulence. Arriving traffic to O’Hare was backed up, so Flight 4184 was told to hold at LUCIT Intersection, southeast of O’Hare. The ATR entered the holding pattern at 10,000 feet, then was cleared to 8,000 feet. In the hold, the captain remarked how “this thing gets a high deck angle in these turns.” The first officer asked, “do you want flaps 15?”
“I’ll be ready for that stall procedure here pretty soon,” the captain said. So the flaps were set to a 15-degree deflection, the nose came to a more level attitude, and the crew advanced power. “That’s much nicer, flaps 15,” the first officer said. Seven seconds later, one of the pilots said, “I’m showing some ice now.” Some six minutes later, someone said, “we still got ice.” It was the crew’s last mention of icing conditions.
During the descent to 8,000 feet in the hold, the ATR’s airspeed went to 186 KIAS—fast enough to trigger the flap-overspeed warning. The captain then retracted the flaps to the 0-degree position. Passing through 9,130 feet, the airplane’s angle of attack increased through five degrees, then the ailerons deflected to the right wing down (RWD) position. A half-second after that, the ailerons suddenly deflected more, to 13.43 degrees RWD—and the autopilot simultaneously disconnected, automatically. A roll 77 degrees to the right ensued, followed by a roll back to 59 degrees RWD, then there was a brief return to wings level. The pitch attitude went 15 degrees nose down, the captain exerted strong aft-stick pressure, and then the airplane rolled rapidly back to the right, at a rate of 50 degrees per second. With both pilots hauling back on their yokes, the ATR went through 120 degrees of roll, and finally stopped at 144 degrees RWD.
After this, the airplane rolled left, then right again as airspeed built to 260 KIAS. Going through 6,000 feet, the airplane was in a 60-degree nose-down attitude, and experiencing between two and 2.5 Gs. Ultimately, the pitch attitude reached a maximum of 73 degrees nose down as the airplane reached 300, then 375 KIAS and 3.6 Gs. The ATR hit the ground in a partially inverted attitude, killing all 68 persons aboard. Based on flight data recorder information, the NTSB said that this fatal upset happened just 24 minutes after the first icing-induced drag increases occurred.
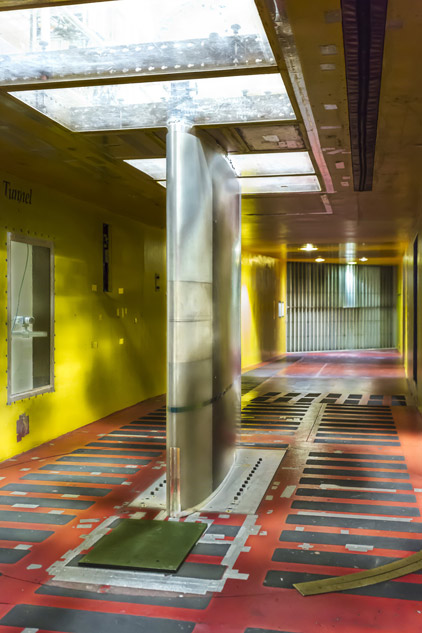
The NASA Glenn Research Center’s icing wind tunnel uses an array of spray bars to create the varying conditions defined in icing certification regulations. Nozzles at the spray bar trailing edges can be made to eject droplets that create icing clouds of differing properties.
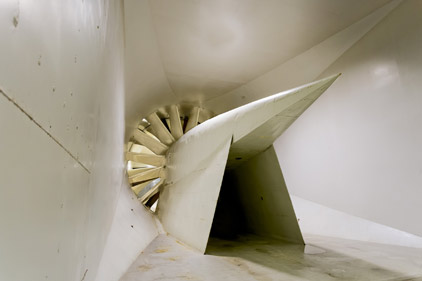
The driver behind the NASA Glenn Research Center icing wind tunnel (above) is this 5,000-horsepower, variable-speed electric motor that drives a 24-foot-diameter fan made of Sitka spruce.inside the icing wind tunnel’s test section. Here, an airfoil is mounted vertically in the six-foot-high, nine-foot-wide, 20-foot-long chamber. The control room is next door.
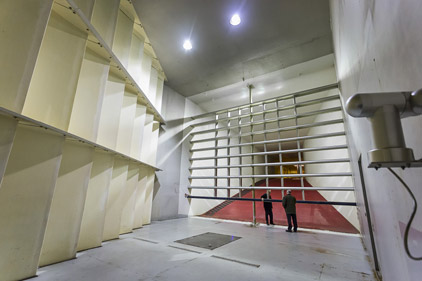
Inside the icing wind tunnel's test section. Here, an airfoil is mounted vertically in the six-foot-high, nine-foot-wide, 20-foot-long chamber. The control room is next door.