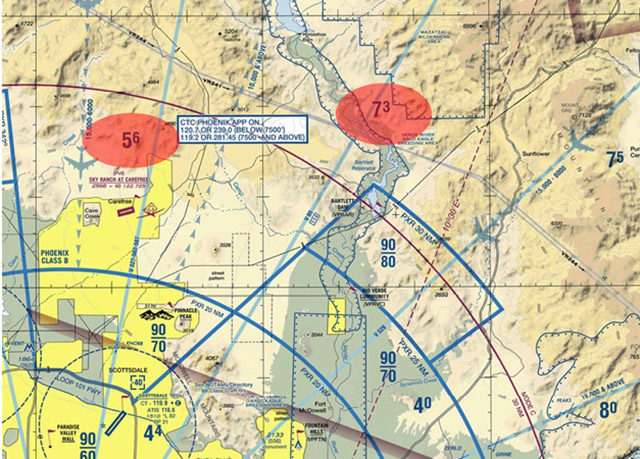
It’s amazing how much information gets crammed into a sectional chart. At a scale of 1:500,000, there’s a lot of detail on airports, airspace, navigational aids, and, of course, topography, rendering a useful overview of a large area. But when you’re about to fly in or near a Class B airport, you might find its VFR terminal area chart (TAC) more helpful as it zooms into specific details that can aid visual orientation in dense traffic areas surrounding these airports. TAC coverage is delineated on a sectional chart by a quarter-inch white, masked line.
What else can you find in a TAC? With a scale of 1:250,000, the TAC is able to drill down into the finer details of specific landmarks, obstacle heights, and where you can expect in- and outbound commercial airlines to fly. Both sectional and terminal area charts show maximum elevation figures (MEF). However, TAC quadrants are half the size of those found on sectional charts providing more comprehensive MEF heights for a given area. Beware of those variances between the charts, especially in mountainous terrain.
Email [email protected]

Machteld Smith
Related Articles