Performance: The perfect aircraft (for the mission)
No such thing as ‘no compromises’

Power loading and wing loading values are shown for several general aviation aircraft. Although these aircraft are not necessarily directly comparable (as some flight characteristics can depend on other factors such as choice of wing and planform shape), general trends are evident. The aircraft in the upper right represent efficient and stable cross-country/instrument platforms while those in the lower left feature better short-field performance. The aircraft in the upper left of the diagram offer an economical training platform that allows the pilot to master energy management. Note that the contribution of high-lift devices such as flaps has been ignored, so the short-field performance of aircraft with a higher wing loading might be better than predicted based on its position on the scatter plot.
While I may never fly the aircraft, it’s fun to explore and marvel at the choices made in its design process. The list of specifications offers performance data such as cruise speed and stall speed that make it clear whether this aircraft was intended to be an efficient and comfortable cross-country platform or to be operated from short, unimproved strips in the mountains.
Wing loading and power loading are part of that list as well, but what they betray about the aircraft mission may not be as obvious. Let’s define these terms and see what they can tell us about the aircraft’s intended mission.
In his book Aircraft Performance and Design, John D. Anderson details the typical order of events in the design process of a propeller-driven aircraft. The process sheds light on the significance of wing loading and power loading values and the associated flying characteristics.
It starts with consideration of a set of specifications defined by the intended mission of the aircraft. For example, this set of requirements might include payload of at least 900 pounds, maximum cruise speed of 200 knots, clean stalling speed of no more than 70 knots, landing distance of no more than 1,800 feet, and takeoff distance to clear a 50-foot obstacle of no more than 2,100 feet.
Anderson explains that, after forming a rough estimate of the aircraft’s maximum gross weight, the designer chooses the airfoils from which the wing will be formed. The relationship between the coefficient of lift and the angle of attack (see p. 88), as well as the shape of the wing, contributes to the qualities of the stall. Additionally, the maximum lift coefficient that occurs at the critical angle of attack plays a key role in the formulas for stall speed, takeoff distance, and maximum cruise speed.
Wing loading is the maximum gross weight of the aircraft divided by the wing area, and this term appears in the formula for stall speed. In particular, as wing loading increases, so does the stall speed. Using the maximum lift coefficient and the maximum desired stall speed, the designer computes a maximum value for the wing loading. Similarly, landing distance increases with an increase in wing loading, so the landing distance requirement provides another bound for wing loading.
Choosing the smaller of these values for wing loading, along with the estimate of maximum gross weight, results in a minimum value for the wing area.
Thrust-to-weight ratio, along with the maximum lift coefficient and wing loading, appears in the formulas for takeoff distance, rate of climb, and maximum cruise speed. It makes sense that a higher thrust-to-weight ratio provides a shorter takeoff distance, higher rate of climb, and greater maximum cruise speed. Choosing thrust to weight as the highest of the values obtained by these constraints, we get the required value for thrust. During the takeoff roll, the required power is equal to the thrust times the speed, so we can calculate the power the engine needs to produce. Because of inefficiencies in the engine/propeller combination, the chosen rated power of the engine should be greater than the required power. The power loading of the aircraft is maximum gross weight divided by the chosen rated power. Note that a low power loading value corresponds to an aircraft with a more powerful engine and/or a lower gross weight. Low power loading means better performance.

What do wing loading and power loading say about an aircraft? We can tease this information from Anderson’s description of the design process. With other factors remaining constant, an aircraft with a higher wing loading features a higher maximum cruise speed. Wing loading is inversely related to gust sensitivity, so a higher wing loading provides a more stable platform for instrument flying. Aircraft design always involves tradeoffs and high wing loading is no exception—it comes at the expense of a higher stall speed and longer takeoff and landing distances. To curb these negative effects, high lift devices such as flaps create a more bird-like wing shape for better low-speed flight characteristics in the landing phase.
Aircraft intended for operation out of shorter strips and less forgiving terrain often have a lower wing loading, with an attendant decreased stall speed and shorter takeoff and landing distances. Here the price involves a reduced maximum cruise speed. These short takeoff and landing (STOL) aircraft operate on the slower end of the airspeed spectrum and are not optimized for long cross-country flights.
A low power loading results in better takeoff performance, better climb rates, and higher cruise speeds. At first pass, there appears to be no downside to such an increase in engine power. But that increase often comes at a price of a higher engine weight (and therefore the power loading might not actually decrease) and increased fuel consumption. Higher fuel consumption shortens endurance and, depending on cruise speeds, could reduce the range. The diagram on p. 87 offers wing loading and power loading values for a range of general aviation aircraft.
An interesting side note involves the 1903 Wright Flyer. Just one of the goals that Orville and Wilbur Wright achieved to make possible their historic flight was their invention of a powerful yet lightweight engine. They fabricated an engine that produced 12 horsepower and, assuming a roughly 775-pound gross aircraft weight (605-pound empty weight with a 170-pound pilot), the power loading comes in at 64.6 pounds per horsepower—a major feat for the day. The vast 510 square feet of wing area made the wing loading only 1.5 pounds per square foot. (To put things in perspective, a Cessna 172S has a wing loading of 14.7 pounds per square foot; a Cirrus SR22 has a wing loading of 23.5 pounds per square foot.)
With all the compromises aircraft design entails there is no such thing as a perfect aircraft. But you can be sure that each one was carefully crafted by its designer to be optimal for the intended mission. The next time you read the specifications of an aircraft perhaps the wing loading and power loading values will tell you something about the nature of that mission.
Catherine Cavagnaro is an aerobatics instructor (aceaerobaticschool.com), professor of mathematics at Sewanee: The University of the South, and speaker at AOPA fly-ins.
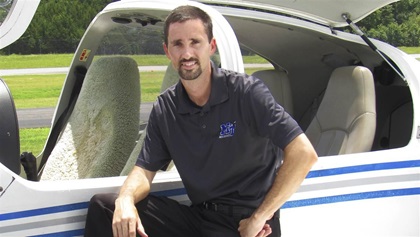 Joseph Patterson, Assistant Chief Flight Instructor, Middle Tennessee State University—Diamond DA40: The ramp at the Murfreesboro Municipal Airport is home to an impressive collection of Diamond aircraft. Flight students at MTSU start in the DA40 as student pilots and stay in it for all their single-engine training. The DA40 especially shines as a stable instrument platform and an efficient cross-country aircraft. Patterson says that MTSU made the switch to the DA40 more than 15 years ago, in part because the sticker price made it the best choice and “it was the newest thing out there. The Garmin G1000-equipped DA40 qualifies it as a technically advanced aircraft so, with recent regulatory changes, students can use it to satisfy complex time required for the commercial certificate.”
 Bruce Williams, Aerobatics Instructor—Extra 300L: The Extra 300 provides a nimble platform for competition and airshow aerobatics, and Williams finds it a perfect training platform, as well. “The wide envelope—with two on board, the G limits are plus or minus 10—means that you can explore the corners of the envelope without stressing the airframe. Although we never approach those extremes in training, that span means I can let customers recover from botched maneuvers without intervening immediately to keep us inside the limits. Now, you don’t need a high-performance aircraft like an Extra to deliver great training, but the capability of the airplane allows you to perform several maneuvers in sequence while preserving energy.” He adds, “You can’t learn if you don’t enjoy the experience,” and his students return from training flights with huge smiles.
 Catherine Cavagnaro, Aerobatics Instructor—Cessna 152 Aerobat: With its low roll rate, high power loading, and lack of inverted fuel and oil systems (inverted flight can’t last long), the Cessna 152 Aerobat doesn’t boast the aerobatic prowess of an Extra 300 or a Pitts Special. Still, the Aerobat serves as a terrific platform for spin, aerobatic, and emergency situation training where learning energy management skills is a high priority. Most general aviation aircraft, of course, are not optimized for aerobatics, so they will respond much like the Aerobat in a sticky situation. Still, the turn rate during a spin is impressive and it will not recover from the spin simply by releasing control inputs. The Aerobat recovers predictably by using the procedure from the operating handbook.
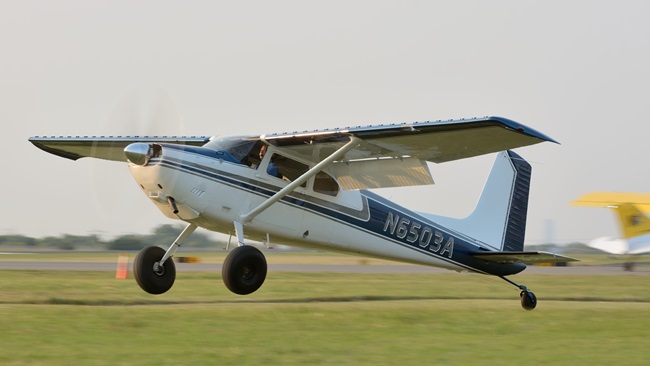
 Sheldon Brown, Retired Airline Pilot—CubCrafters Carbon Cub: Brown and his wife, Billye, fly their CarbonCub almost daily in southeast Tennessee and find it exceptional for flying in and out of short, unimproved landing strips—even on days where density altitude leaves other airplanes in the hangar. Its high lift devices such as flaps and vortex generators give the Carbon Cub a stall speed of only 32 miles per hour. Brown says, “All of the above impressive stats were just icing on the cake. The biggest reason I bought the Cub was that I wanted a challenge, and flying a tailwheel aircraft provides just that. All-weather flying ended with my airline retirement. Furthermore, since the Cub qualifies as a Light Sport aircraft, I don’t even need a medical certificate to fly it.”
Photography top to bottom: Kayla Patterson, Felix Knaack, Pete Haight, Pete Haight
Catherine Cavagnaro
Related Articles