Proficiency: Behind the power curve
Where it takes more power to fly slower

You’re on final, and see you’re losing altitude. The VASI lights are all red. The trees are getting closer. It’s clear that on your present approach path you’re on target to land well short of the runway. In an attempt to arrest the descent and set things right, you add power and raise the nose.
Bad move. You’re still sinking, even though you’ve gone to full power in what is now a desperate effort to climb. Welcome to what’s commonly known as the back side of the power curve, or the “region of reversed command.” It’s not a happy place, and it’s worth a review of some basics in order to avoid it. These basics have to do with the relationship between drag and power.
First off, there are two main types of drag. Parasite drag is the drag created by the airframe’s resistance to forward motion. Put your arm out of a car window as it’s cruising down the road—your arm is creating parasite drag. There are subsets of this type of drag, such as cooling drag (drag created by cooling inlets) and interference drag (drag created by flow interruptions and turbulence where wings meet fuselages, and where engine nacelles join wings), but the upshot is the same: the faster you fly, the greater the parasite drag. Double your airspeed, and parasite drag quadruples.
Induced drag is a byproduct of lift, and it’s greatest at high angles of attack and slow airspeeds. In this condition, the lift that supports the airplane’s weight (effective lift) acts vertically but, as always, the total lift generated by the wing acts perpendicular to the wing chord. At high angles of attack, this perpendicular force exerts strong amounts of rearward force opposite to the direction of flight—and that’s induced drag.
So just as parasite drag is highest at high airspeeds, induced drag is greatest when flying slow and nose-high. And the greater the angle of attack and the slower you fly, the more you’ll continue that way. Practicing slow flight at minimum controllable airspeed gives you a good introduction to how an airplane behaves with lots of induced drag.
How to overcome parasite drag? Add more power! But at some point the drag will be too great for the power available, and that’s when you reach maximum level airspeeds. As for induced drag, the problem is trickier. To maintain altitude, you’ll need more power—a lot more, as you continue to increase the attack of attack. But at some point there will come a reckoning. All the power you’ve got simply won’t be able to keep the airplane in the air. It will stall.
This is a much worse outcome than hitting the high-speed wall created by parasite drag. You’re low, slow, powered up, and mushing on short final. The only way out is to lower the nose, reduce the angle of attack and try to go around—here’s hoping there’s enough altitude and time to carry the day.
Lowering the nose to gain altitude, and raising it to lose altitude, may sound counterintuitive, which is one reason why the back side of the power curve is called the region of reversed command. On the front side of the power curve the airplane behaves according to popular notions: raising the nose brings altitude gains, lowering it causes descents.
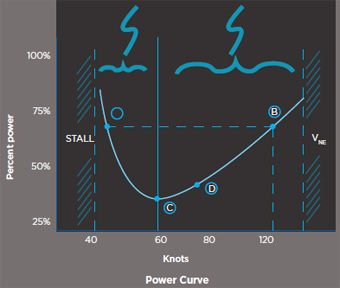
Is there a dividing line between the front and back sides of the power curve? You bet, and we’ve plotted an accompanying stereotypical power curve (previous page) to show it. Notice the other points we’ve plotted along the curve. At either end of the curve it’s easy to see where the stall speed and redline occur, but it’s also worthwhile noting that it takes as much power to fly this hypothetical airplane at 40 knots (A) as it does to fly at its maximum cruise speed of 120 knots (B).
Point C illustrates the airspeed and power combination that produces maximum endurance. Why? Because this is where minimum power is required for level flight, and where the lowest fuel flows occur. Point D represents the condition for maximum range. Why? Because for just a little more fuel consumption, airspeeds rise significantly higher than in point C.
The power curve’s biggest lessons speak to those flying too low on final. Use all the vertical guidance available when approaching the runway, fly at the proper airspeed and in the proper configuration, and watch your planned touchdown spot for any movement. If it moves toward you, you’re high; if it’s moving away from you, you’ll land short. And you’re probably on the back side of the power curve. Best to add power, go around, and try again. Anything but mushing toward terra firma, as hundreds of pilots have learned the hard way.
Email [email protected]


