WX watch: Ice advice, with Nexrad
Signs of melting precip aloft—and plenty of caveats
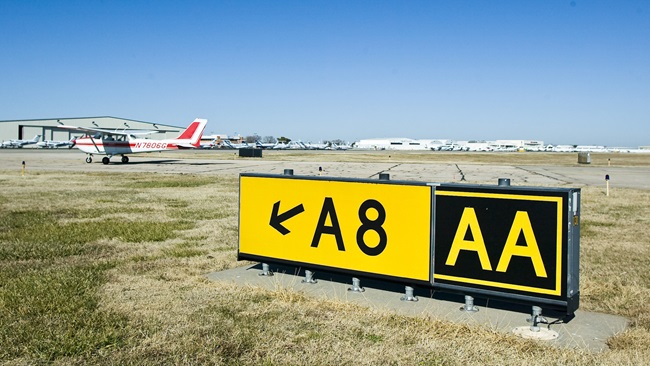
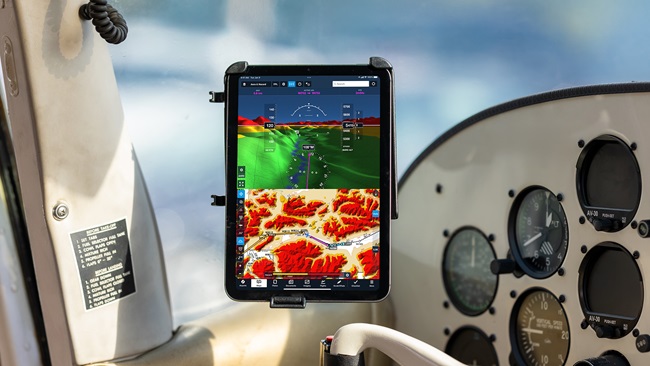
Now that so many of us now use datalinked Nexrad radar imagery, a lot of pilots have come to rely on it as gospel. It is very helpful in making assessments of the movement, and the changes, occurring within areas of precipitation. No doubt about that. Sure, there are downsides. A big one has to do with the lag between when the radar imagery was captured and when it reaches the cockpit. In short, the imagery you see on your cockpit display may be as much as five to 20 minutes old, depending on the service provider. The National Transportation Safety Board warned us that delays like this can be dangerous, as described in a 2012 Safety Alert. The Alert cites accidents where pilots apparently thought they were skirting convection, only to find that it had already overtaken them.
For this reason, steer well clear of any dangerous-looking radar signatures. An echo that’s five minutes old may seem current enough for us to safely weave around. But five minutes is a lot of time when thunderstorm clouds are rapidly building. The moral: don’t use datalink imagery for tactical avoidance. You may think you’re weaving around a storm cell, but in fact you may be steering for what could now be the heart of an aggressive buildup. A better move is to fly far around any dangerous-looking radar returns, avoiding them by at least 20 nm. These include precipitation returns containing hooks, lines, scalloped edges, steep reflectivity gradients, as well as bow echoes—which are indicators of strong gust fronts or outflow boundaries.
- The winter months are upon us, and convection is less of a threat, but Nexrad is still useful for avoiding ice. The cardinal rules for safe winter weather flying still stand:
- As part of a good preflight briefing, be sure to check airmets for icing, satellite imagery for cloud coverage top information, and TAF and METARs to learn which airports promise ice-free arrivals.
- Keep a close eye on the outside air temperature (OAT).
- Avoid clouds and precipitation when OATs are between plus-5 and minus-20 degrees Celsius.
- Should you encounter icing conditions, exit them as soon as possible. This is why you want high cloud bases and low cloud tops for ideal winter flying.
The temperatures between zero and minus-5 degrees Celsius are the most dangerous when flying in visible moisture. Freezing rain and large-droplet icing is likely, especially in regions with large bodies of water nearby.
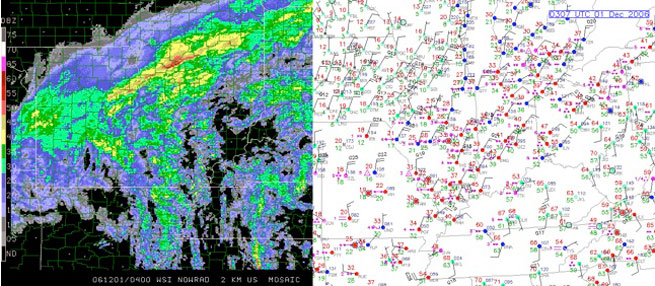
Bright banding. Nexrad imagery often does a fairly good job of identifying cloud and precipitation zones where zero Celsius may exist. This is especially true in frontal weather, so this feature can come in handy during the colder months. Imagine you’re flying along on an IFR flight plan, looking ahead at a fairly uniform pattern of light to moderate precipitation returns.
In the middle of this uniform return you see a dense band of high reflectivity—yellows, oranges, and reds. Many times this band will completely encircle a radar site. What’s going on? It’s quite likely to be a phenomenon called bright banding. It happens when falling snow, ice pellets (sleet), or hail encounters above-freezing temperatures on the way down.
As this falling precipitation begins to melt, water covers the exterior of the snowflakes, ice pellets, or what have you. This water coating gives the particles high reflectivity values—much higher than plain-Jane dry snow or other frozen precipitation. Wet hail—hail that has begun to thaw—has the highest reflectivity values of any type of precipitation, which explains why wet hail shows up bright red (purple on some displays) on Nexrad imagery.
If there’s anything good we can learn from bright banding, it’s that warmer temperatures are below them. The bad news is that we need to know the radar antenna’s elevation angle (available for preflight scrutiny on some websites such as www.wunderground.com/radar/map.asp) in order to get an idea of the altitude of the return—which typically will go up the farther the returns are from the radar site (which we must also know). Try the beamwidth tool to get an idea of the scanning angles for various elevations. (It surprised me to learn that the lowest antenna elevation—0.5 degrees—doesn’t work at all well when looking for low-altitude precip returns at ranges beyond 50 nm!)
Tactically speaking, that “warm air below” advice can be tricky. There could be multiple freezing levels below bright banding returns. You may be free of icing conditions for a time, only to reenter them. As in thunderstorm season, the best way of using Nexrad for adverse weather avoidance is to steer well clear of bright banding returns.
Email [email protected]