Wx Watch: Advance warnings
Charting convective sigmets before they happen
Website of the month: Plymouth State’s archived METARs
Ever looked at a past logbook entry and wondered what the weather was like for that epic crosswind landing you botched at an en route stop? Or maybe you’re into some legalistic research to confirm anecdotal reports of airport weather conditions? Even better, are you making bets about the weather at a certain date, time, and airport? Well, a visit to Plymouth State University’s Weather Center’s archived METAR page is here to settle any and all arguments and it’s easy to use. Just select the state, raw or decoded METAR format, date and Zulu time, then hit “click to make the list.” Up pop all the METARs for the selected date and time. Archives only go back to 1998, so there is a limit to your back-orders. Please don’t forget to send me a small portion of any winning wagers!—TAH
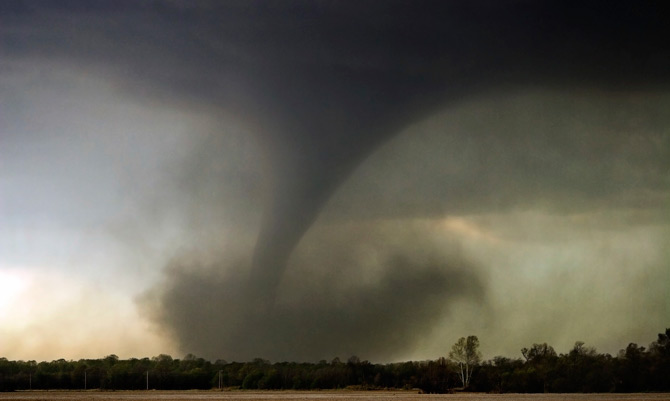
The 2012 tornado season got off to an early start when a particularly strong and long-lasting outbreak of tornadoes cropped up in Missouri in February and struck southern Indiana on March 1, intensified, moved east, and ended up devastating large areas of the Ohio Valley on March 2. An amazing total of 159 storm reports were made that day, many of them causing fatalities. Although the tornado damage to Henryville, Indiana, garnered much of the media coverage, Mariba, Kentucky, suffered eight killed—the highest number of fatalities during this tornado outbreak.
This particular weather setup involved a deep surface low moving from Missouri to Illinois on March 2, dragging loads of unstable air from the south and moving it up and over a warm frontal boundary that bulged northward, over southern Illinois and Kentucky. Behind the warm front was a dry line—a delineation between moist and dry air. This unstable feature is typically found in Texas and the Plains states, but on March 2 a dry line was stalking western Kentucky and Tennessee.
What created the deep low and tornado dynamics? A 100-knot streak of jet stream winds to the west of the surface low. It’s a complicated subject, but suffice it to say that jet stream streaks containing very high cores of maximum winds cause rising motions in the air ahead of them. If the air is unstable enough, these rising motions receive the spin they need to generate supercell thunderstorms over wide areas. Which is exactly what happened that day in March.
The Ohio Valley was definitely not a place to be flying that day. And to my knowledge there were no aviation accidents related to this storm system. Maybe that’s because there was plenty of warning. I’m not referring to convective sigmets here. Those are issued the same day, when thunderstorms begin popping up. No, I’m talking about three days’ worth of warning for the March 2 events.
When convective preconditions are right, computer models and expert meteorological analysis can pick up dangerous trends surprisingly early.
You often hear pilots griping about weather surprises and blown forecasts. Yep, it happens. But when convective preconditions are right, computer models and expert meteorological analysis can pick up dangerous trends surprisingly early. These are posted on the convective outlooks published by the National Oceanographic and Atmospheric Administration’s (NOAA) Storm Prediction Center (SPC) in Norman, Oklahoma. These outlooks are intended primarily for “sophisticated weather users,” according to the SPC. I don’t know what that means, but I’d say pilots fit the description, don’t you? Perhaps they’re referring to the technical language used in the text synopses that accompany the storm graphics, most of which I think we can decipher based on the weather information we learn in pilot training.
Normally I save any discussions of weather websites for the “Website of the Month” feature that’s often appended to Wx Watch, but this month I’m making an exception and talking a bit about the convective outlook pages of the SPC’s website here, because I think they can be so useful in trip planning in the warmer months. Thinking of a trip a couple of days in the future? Please, check out the convective outlooks.
Day 1, 2, and 3
Once you call up the website, you’ll see maps titled Current Day One, Two, and Three. Day One is today, Day Two tomorrow, Day Three the next day. Check the valid dates and times to pin down the issue and valid times and dates for each product.
If anything is cooking convection-wise, you’ll see shaded areas delineating any zones that are expected to have a slight (SLGT—small numbers and low coverage by thunderstorms), moderate (MDT—a greater concentration of anticipated storms), and high (HIGH—a major severe weather outbreak with strong tornadoes and long-lived winds called derechos that could have gusts as high as 80 mph)—all of this at the surface.
You’ll see charts showing both categorical and probabilistic outlooks. The categorical outlooks outline the SLGT, MDT, and HIGH regions. The probabilistic charts give you the percentage chances of a severe weather event within 25 sm of any point in the targeted area. It’s all very intuitive.
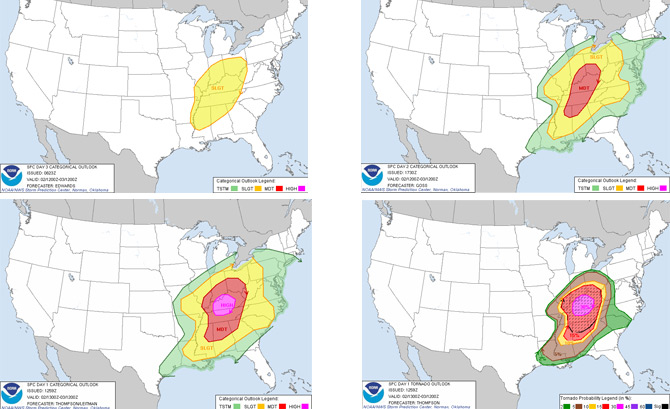
The February 29 convective outlook targeted the Ohio Valley with a slight chance of severe weather three days before the tornado outbreak (top left). The March 1 outlook (top right) increased the risk to moderate. The day of the March 2 outbreak a high risk was put over Kentucky and southern Indiana (above left) and 30-percent and 15-percent risk zones for tornadoes (above right) were identified by the hatch-line areas.
The March 2 event
To see how well the SPC scoped out the March 2 tornado outbreak, see the accompanying charts. I picked the February 29 Day Three outlooks to show what the meteorologists were thinking might happen on March 2. An area with a SLGT chance of well-organized severe thunderstorms is plotted right over the area in question.
March 1’s outlooks reflect newer data, and now the target area is bumped up to a MDT risk of severe storms. By March 2, of course, the problem area is much more accurate on the late-breaking categorical outlook issued at 1303Z—8:30 a.m. EST. Now the risk of an outbreak is HIGH. And no wonder. The first funnel clouds were spotted two hours later in Alabama, followed by the first tornadoes touching down in Illinois at 11:10 a.m. By then the convective sigmets had been coming fast and furious. The first of four reported Henryville tornados struck at 5:14 p.m. EST.
All of this shouldn’t have been a surprise, really. At least not to a pilot checking the convective outlooks for the past three days. Think about that the next time someone complains about a false alarm.
Email the author at [email protected].
Related Articles


