How surface and upper-air patterns team up for trouble
With spring at our doorstep, it’s time to take a look at a couple of the more dangerous convective weather setups you might see on certain weather charts. A briefer may not be able to describe these very well over the telephone, but you should know what to look for when you’re self-briefing. After all, most of us now use the Web for our preflight weather information graphics. The key then becomes knowing what to search, and being able to interpret the signals that warn of potentially severe thunderstorm outbreaks. Bear in mind that these setups involve the interactions between surface-based weather features and the upper-level dynamics that help intensify them.
Beware the warm sector. We’ve talked before about that wedge of warm air located southeast of a surface low and between the low pressure system’s cold and warm fronts. It’s a major trouble spot because the warm sector is fed by southerly flows of warm, moist air from the Gulf of Mexico. Throw in a high-altitude- and/or low-level jet stream’s effects and you might as well guarantee severe thunderstorms. For this reason, we should all be able to recognize—at a glance—what surface-based low pressure systems look like.
Yes, warm-sector thunderstorms are common in the spring-to-autumn time frame. But there are always exceptions, and one occurred in December 2015 when a low pressure system The Weather Channel dubbed “Goliath” bulled its way through the Midwest and Southeast in the days before Christmas. In almost every regard this system was identical in its setup to those we’re accustomed to seeing in the summer months. Climate change and global warming are all big in the news these days—but June weather in the holiday season?
Email [email protected]
Bottom line: If you see any of the following patterns, sit up, take notice, and explore the situation further. Maybe delaying the flight is the best option.
Divergence aloft. Divergence is just a fancy word for air flows that spread out in a fan-like pattern as they move downwind. When this happens at altitude, there’s an outflow aloft that reduces the air density and pressure in a given vertical column of the atmosphere. Nature abhors a vacuum, so low-level air converges to compensate for the divergence aloft—and you know what that means. The converging, low-level air either creates or enhances low pressure systems, which in turn can cause rising air, condensation, and, ultimately, thunderstorms if unstable conditions (comparatively cold temperatures aloft) are present.
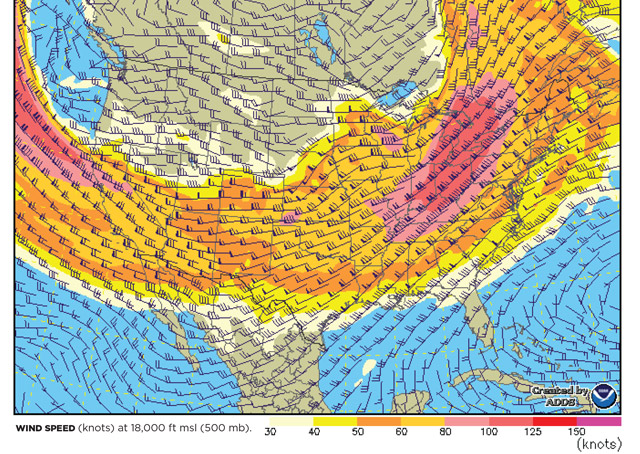
Divergence aloft can be seen on 500-millibar constant pressure charts, which correlate to the wind and temperature conditions at 18,000 feet msl. Many times, divergence is associated with jet stream flows at low (say, 850 millibars/5,000 feet msl) or high (300 millibars/30,000 feet msl) altitudes, so you’ll want to look at both those constant pressure charts.
Low-level jet streams (LLJs). In the Great Plains as well as “Tornado Alley” (a broad, roughly cone-shaped band stretching from Texas and Oklahoma to the north and northeast as far as Iowa and Ohio), LLJs with winds of 25 to 70 knots or more are notorious for causing summer thunderstorms. At night, temperature differences between colder air to the west and warmer air to the east cause air at 5,000 feet to converge and then flow northward. Temperature contrasts are greatest in the early-morning hours, but as the day warms the contrasts decrease and winds subside.
The convergence around an axis of strongest LLJ flows can also boost convection in the warm sector of a surface low pressure system. So when flying in the Midwest, beware any strong southerly winds. If flying north, you may get a fantastic tailwind from an LLJ—but there’s the risk of thunderstorms if fronts or other instability-makers are around. Oh, and don’t be surprised if you encounter significant wind shear and turbulence if you climb or descend through an LLJ.
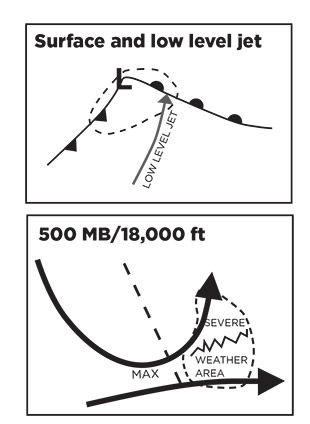
Low-level jet stream (top) enhances severe potential in the dashed area. A 500-millibar pattern like the one at bottom left is an indicator of a large, severe weather outbreak.
Website of the month
Get the lowdown on space weather
You’re flying along, then all of a sudden your GPS throws in the towel. What happened? Military shutdown of the satellite network? Maybe. But a solar coronal mass ejection (CME) might be to blame. Maybe you should have checked the Space Weather Prediction Center’s website before you took off. The website discusses the day’s solar flare situation, reviews case studies of past CMEs and the havoc they caused, and has links to aviation-related CME advice. Perhaps best of all are the time-lapse images of today’s solar flares, and an animated polar view of forecast auroras.