Wx Watch: Nor'easter super slam
The inside scoop on Mid-Atlantic coastal storms
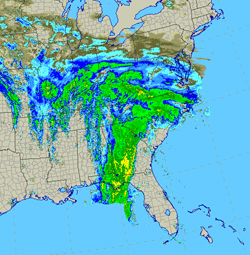 The radar map for late in the day on February 5 shows a classic mid-latitude low pressure system’s frontal signature (left). At this point the low pressure center is somewhere over South Carolina. The cold front’s precipitation runs north-south from the Carolinas to the panhandle of Florida. The warm front of this Nor’easter-to-be ranges from Ohio to the Mid-Atlantic. The warm front brought the first snows, leaving many airports looking like the one below.
For the Mid-Atlantic states, this past winter was a record-breaker. As of this writing (February 12, 2010), a total of some 56 inches of snow had fallen in the Washington, D.C., area alone; climatologically speaking, the norm is around 18 inches. Most of the snowfall came via two successive winter storm systems known colloquially as “Nor’easters” or, if you prefer, “Northeasters.” Nor’easters get their names because of the strong northeasterly winds that accompany their parent low-pressure centers. It would be just as correct to call them “East Coast deep extra-tropical winter low pressure systems,” but somehow we keep calling them Nor’easters—perhaps to sound more like the New Englanders they so often affect.
This season’s one-two punch debuted with a system that passed through on February 5 and 6. It broke 100-year records for single snowfalls in the Mid-Atlantic, leaving behind more than two feet of snow. The second blow came just three days later, lasting from February 9 through 10 and leaving an average of 12 additional inches of snow across the region. Both systems followed the same basic track and evolution.
These snowfalls shut down the federal government, state governments, military bases, and even caused snowplows to become stuck. As for flying, the effect of these storms was monumental. Airports large and small were closed all along the Mid-Atlantic coastal region in a swath that ranged as far west as Ohio and western Pennsylvania. Airplanes en route to affected airports diverted to their alternates, facing the worst icing conditions as they fled. The airlines flew their airplanes out of airports in the storms’ paths in advance, lest they become stranded.
Airports that had just struggled to clear the first storm’s snow approached the second snowfalls with a new problem: where to dump the now-towering mounds of plowed snow. In yet another reminder of the dangers of heavy snowfalls on aviation operations, on February 6 a hangar roof at the Dulles Jet Center at Washington-Dulles International Airport collapsed under the weight of the snow. Two Bombardier Global Expresses and a Gulfstream G550 were totaled.
When we think of snowstorms, most of us have the idea that they’re products of low-pressure systems that originate in the Pacific Northwest or Canada, and ride eastward on prevailing westerly winds aloft. Many times that’s true, but not with Nor’easters. Nor’easters get their act together in much warmer climes. Typically, they start out as one or more mini-low pressure centers in east Texas or the deep South. And so it was with the storms of February.
The first storm began on February 5 as low-pressure complex just south of the Florida panhandle, complete with warm and cold fronts. A deep trough aloft intensified this low, then propelled the whole works northeastward on 60- to 70-knot winds—right toward the Mid-Atlantic states. Along the way, as the system drew in more warm, moist air from the Gulf of Mexico, the low’s central pressures dropped, the surrounding isobars tightened, surface winds picked up, subfreezing air was drawn into the system, and the warm front became a memory.
By midday February 6, the trough aloft had shifted to the east, moving the original low-pressure center with it. Now it was just off the Virginia coast, and instrument meteorological conditions (IMC) and snow had covered entire states. Meanwhile, an additional counterclockwise circulation at 500 millibars (about 18,000 feet msl) created a secondary surface low over West Virginia.
Once off the coast, the storm assumed the classic Nor’easter profile. The central low pressure deepened further—surface barometric pressure plunged to a hurricane-like 986 mb, or 29.12 inches of mercury—and wind speeds rose to 50-plus knots. By the afternoon of February 6 the secondary low “center-jumped” to the main low off the coast, merged with it, and caused an ever-tightening gradient between isobars—creating a circular, bull’s-eye pattern. This also helped the system look hurricane-like on weather charts. But unlike hurricanes and tropical storms, which have warm air at their cores, Nor’easters are “cold core” storms that bring continental, colder air masses to warmer, marine-influenced air.
On its second day of life, this Nor’easter was drawing in cold air from the northeast while at the same time sending warmer, more moist air from the Atlantic Ocean to the west. The point where these two different air masses collided made all the difference in the world to the nature of the Mid-Atlantic’s weather.
Imagine this: sopping wet air aloft, screaming off the ocean from the northeast, wrapping around the coastal low, and running into 20- to 30-degree Fahrenheit air over the Mid-Atlantic states. In a manner similar to the workings of a warm front, the comparatively warmer oceanic air rides up and over a wedge of colder, denser air nearer the surface. Where this wedge is thinner, precipitation falling through it occurs as rain, freezing rain, or ice pellets (sleet). Where the cold wedge is about 2,000 feet deep, or more, there’s enough vertical distance—and time—for the precipitation to crystallize in subfreezing temperatures, and fall as snow.
But what will fall where? What marks the dividing line? This is where a meteorological rule of thumb kicks in. It deals with the thickness of the atmosphere between the surface and 500 millibars/18,000 feet msl. Bear in mind that the molecules in warmer air are farther apart than those of colder air. Therefore, the height of a constant-pressure surface is higher in warm air and lower in cold air. The 1,000- to 500-millibar thickness chart illustrates this principle, and identifies the thickness line that, loosely speaking, can mark the divide between precipitation falling as rain or snow. That line represents a thickness of 5,400 meters, is labeled with a “540” on the chart, and is called the “540 line,” or rain/snow line. At thicknesses greater than 5,400 meters, temperatures are warmer and precipitation usually falls as rain; below 5,400 meters, it’s colder, and likely to be snowing at the surface.
The guidance from the 540 line is far from gospel, however. Models can be wrong, for example, and shallow layers of warm air can make it rain where the thickness chart says it will snow. Meteorologists often hedge their bets when thicknesses are lower than 5,400 meters, saying that there’s a 50/50 chance of snow at surface elevations below 1,000 feet msl.
Many of the computer models forecasting the 540 line for February 6 did fairly well, but some put the rain/snow demarcation line farther inland than it really was. When it came to predicting both Nor’easters’ tracks and precipitation levels, the models did a better job.
That’s something for pilots flying in or through the Mid-Atlantic or New England to remember when looking over preflight weather information. Nor’easters tend to telegraph their intentions days before they ripen into ugly airmets and sigmets. So next winter season, look for the warning signs—low pressure near the Gulf of Mexico, a trough aloft over that low, and upper-level winds that are taking dead aim to the “nor’east.”
E-mail the author at [email protected].
Related Articles


