Wx Watch: Datalink lowdown
Looking at thunderstorms from two different angles
 Datalink weather information—especially datalinked Nexrad radar imagery—has created a revolution in the way pilots approach thunderstorm avoidance. In the recent past, general aviation pilots could often find themselves on instruments, flying blind in situations where embedded thunderstorms lurked dangerously near. Sure, those with the luxury of airborne weather radar have the advantage of scanning the skies for precipitation returns that indicate convection. But it takes skill and experience to learn to manage airborne weather radar tilt angles, and even more skill to correctly interpret radar imagery on the fly.
Today’s datalinked Nexrad imagery is much more intuitive. It also covers a greater volume of sky, and its resolution benefits from the ground-based Nexrad radar’s small, powerful beam—a beam that can see clear through a thunderstorm, and beyond. Airborne weather radars suffer from attenuation of their signals, which means that heavy precipitation can absorb the comparatively weaker radar’s transmitted energy and send back an image that gives false returns. What look like navigable passageways through a line of radar returns may actually be the worst parts of the storm system. “Clear” areas behind strong storm cells may really be convective danger zones hidden in these radar shadows.
 How much better to have datalinked radar! We can see where airborne radar can’t, locate dangerous radar signatures with ease, and instantly grasp the true extent of any precipitation or thunderstorms. The big caveat? Don’t use datalinked Nexrad imagery for tactical weather avoidance—to weave around cells or navigate your way through a storm complex, for example. Instead, use it as a strategic tool to cut strong radar returns a wide berth. We all follow this rule, right? Yeah, right.
There are some very good reasons why tactical use around smaller-scale storm features is a no-no. This raises a complex and sometimes controversial subject, but at the heart of the matter is a simple fact: What you’re seeing on your cockpit display is something that happened in the past. In real time, that clear path ahead of you may no longer be clear.
Nexrad basics
To understand some of the traps associated with using datalinked Nexrad, it helps to know a little about their modes of operation. First off, these radars—dubbed WSR-88Ds; the “88” is for the year they debuted, the “D” is for Doppler—are ground-based and have rotating antennas. The antenna dish can be tilted up or down at several angles to scan the sky, and it takes a few minutes for the antenna dish to make a complete rotation. Here’s where the delays begin to kick in.
Nexrad can work in two modes—clear air or precipitation. In clear air mode, the antenna is at its slowest rotation, making up to 14 sweeps at five different tilt angles. In all, it takes about 10 minutes to make a full scan of the atmosphere around the radar site. Clear air mode is used to detect light precipitation and snow because the slow scan rate makes the radar better able to see smaller particulates (birds, bats, and insects, too).
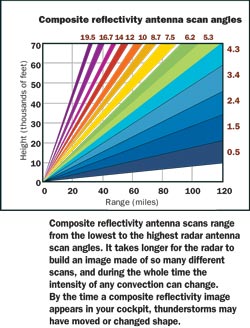
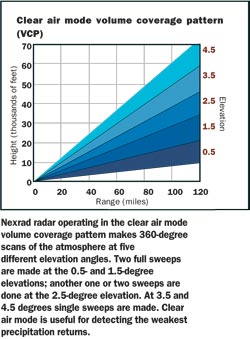 In precipitation mode the antenna rotation rate is faster because precipitation is an excellent reflector of radar energy. In this mode, the antenna scans 14 tilt angles in five minutes, looking upwards as high as 19.5 degrees, and as low as 0.5 degrees. The idea here is to gather as much information as quickly as possible, which is what we want when we’re flying around convective weather. This is what the National Weather Service (NWS) uses most in the summer months when convection is occurring.
There’s a whole lot more to radar meteorology, but that will do for now. Now we know that there are 14 possible tilt angles, and that scanning them all in precipitation mode takes about five minutes per radar site. But wait, it turns out there are two ways of presenting this radar coverage.
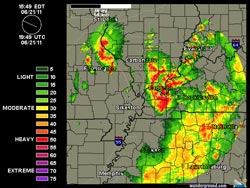
Composite reflectivity
Composite reflectivity imagery shows an amalgam of all the tilt-angle scans. The goal is to depict the maximum echo intensities from any antenna sweep at any elevation angle. Think of a composite reflectivity image as a stacking of individual scan overlays, with each one showing the highest levels of radar reflectivity. The imagery can extend as far as 248 nm from the radar site. But as you might expect, resolution at that range falls off. In addition, at longer ranges, the beams from the higher antenna tilt angles will only “see” precipitation returns occurring at the higher levels of the atmosphere. Building thunderstorm tops at levels below, say, 30,000 feet may go unrecorded, rendering them invisible on your map display.
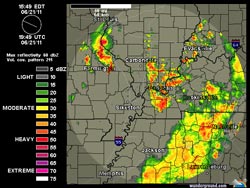
Base reflectivity
On the other hand, base reflectivity shows the results of single sweeps made at the lower antenna tilt angles. Typically, this is the lowest tilt angle—a mere 0.5 degrees above the horizon. Base reflectivity is good for studying storm structure, identifying precipitation at lower levels of the atmosphere (say, below 20,000 feet), and seeing higher-resolution returns. Base reflectivity imagery can extend to ranges as far as 124 nm from the radar site. To see precipitation returns beyond that, you have to consult a neighboring Nexrad site’s results. That’s true for composite reflectivity images as well. That’s why the NWS—as well as private weather suppliers—create radar mosaics that show regional and national precipitation images.
Which is best?
Datalink providers XM WX Satellite Weather and WSI InSight offer pilots a choice. XM WX sends composite reflectivity images to the cockpit, while WSI’s InSight datalink service uses base reflectivity. The “best” service of choice has generated no small amount of controversy in some quarters.
Advocates of composite reflectivity emphasize that it shows a better rendition of precipitation and convective systems as a whole. “You get the whole picture instead of a small slice,” said a representative of Baron Services’ WxWorx (WxWorx provides imagery to XM WX). Other proponents emphasize that composite reflectivity’s many sweeps deep into the flight levels give a better representation of a storm system’s true condition and potential.
WSI chose base reflectivity for several reasons. “You can see the most important parts of radar reflectivity gradients with base,” a WSI spokesman said. “Because of this you get a better snapshot of the weather at altitudes closer to the surface, where embedded conditions are most prevalent, and where more critical decisions must be made quickly.” Resolution of a base reflectivity image is more accurate because it’s the product of a single radar sweep, advocates say. With composite reflectivity, all those sweeps can “smear” the radar image during the time it’s compiled.
 This brings us back to the issue of time delay. Both base and composite reflectivity images may take five minutes for a radar site to compile, but other delays occur when the datalink providers use their expertise to clean up the imagery by removing ground clutter, anomalous propagation, and other spurious returns. Yet another delay comes when a mosaic is made. It’s the mosaic that lets you see a continuous image on your display, instead of multiple circular radar coverage areas from each radar site. Bottom line? It can take between five and 11 minutes from the time a Nexrad radar makes its sweeps to the time it appears in your cockpit. This may not seem like a long time, but a whole lot of storm intensification can occur in those small time frames. And that’s why using datalink radar isn’t the best of ideas for close-in dodging of storm cells.
Of course, online Nexrad radar sources give you the best of both worlds. You can look at composite reflectivity images to see a storm’s behavior and potential aloft, then check base reflectivity to see if the system is “raining out” at lower levels. Looks bad on composite, but looks more benign on base? Then the storm system is most likely in a building phase, and predominated by updrafts. Not much precip on composite, but base is full of red and purple returns? Then the storm is likely in a mature phase, and it’s not a time for taking off or landing.
Whether you have base or composite in your cockpit, datalink radar imagery can show us the best path away from bad situations. Just keep those time delays in mind, and know the strengths and weaknesses of your chosen imagery.
Email the author at [email protected].
Related Articles


