WX Watch: California freezin’
A West Coast icing support system
 Airmets for instrument meteorological conditions (IMC), turbulence, and icing were posted over most of the state, but visual meteorological conditions prevailed over extreme southern California’s Imperial County Airport when the pilot and his passenger took off on a VFR flight in a Beechcraft Bonanza V35A, bound for Fresno, California, to the northwest. After takeoff the pilot climbed to 16,500 feet and obtained VFR flight following service. That choice of altitude may be a clue that the instrument-rated pilot suspected cloud buildups along the way. The Bonanza’s engine was a normally aspirated Continental IO-550.
And evidently there were buildups. The pilot called the Los Angeles Air Route Traffic Control Center, reported clouds ahead, and requested an instrument flight rules (IFR) clearance for the arrival at Fresno’s Yosemite International Airport. It was granted, and the Bonanza was cleared to descend to 14,000 feet. The pilot asked Bakersfield Approach for a lower altitude, and was told to wait for 10 to 12 miles. Then came a clearance to descend first to 7,000 feet. Two minutes later the controller advised the pilot of a report of icing in the area, then came a clearance to descend to 6,000 feet. A controller advised the pilot of nearby outside air temperatures of minus 6 degrees Celsius, but the pilot didn’t respond. Several subsequent attempts to reach the Bonanza pilot were made, with controllers also asking another pilot to try to establish contact. All attempts were unsuccessful, and radar contact with the airplane was lost. The airplane crashed nine miles south of the Tule VOR, killing both aboard.
Every fatal accident report carries its own burden of tragedy and what-ifs, as well as opportunities for often stern, arm’s-length judgment. The airplane was not certified for flight into known icing. There was no record of the pilot’s receiving a preflight weather briefing or looking at weather information before the flight. He had only flown 23 hours in the previous year, with one instrument approach into Fresno. In the end, the NTSB’s ruling on the accident’s probable cause was “An in-flight encounter with icing conditions during descent, which resulted in the airplane exceeding its critical angle of attack and experiencing an aerodynamic stall followed by an in-flight breakup.”
 Accidents like these can serve as valuable instruction in the dynamics of adverse weather. The Bonanza crash’s accident report is somewhat unusual in that it delves into specific meteorological aspects affecting the flight. Upper air soundings are mentioned, along with satellite and Doppler radar observations. The National Climatic Data Center (now the National Center for Environmental Information) stated that the accident took place “in a very favorable location for vertical motion, clouds, and precipitation given the low-, mid-, and upper-level environment.”
So what would a location like this look like on weather graphics you can check during your preflight weather information searches? As an example, let’s look at a few of the graphics from this accident’s NTSB report.
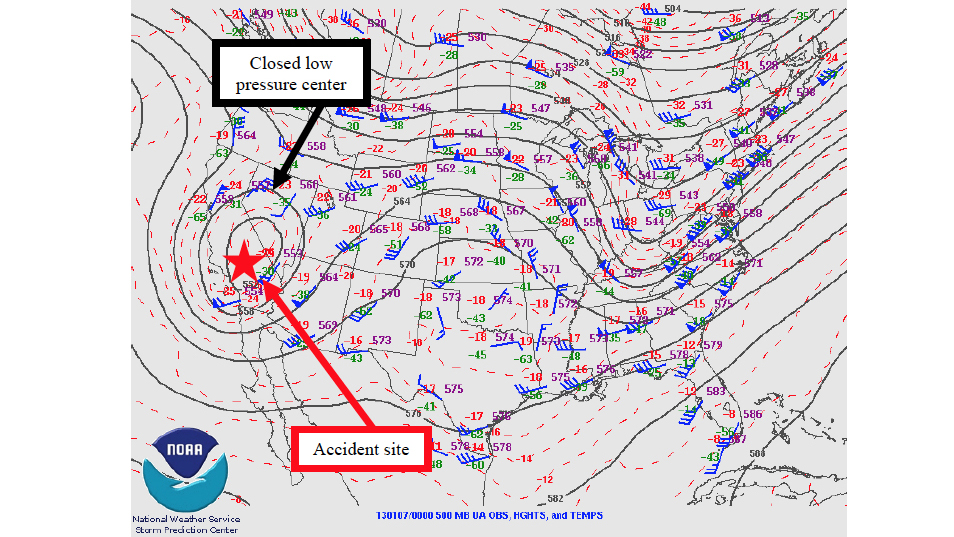
First, it helps to remember that surface low-pressure systems and their fronts are created from the top down. Looking at the 500-millibar constant pressure chart on page 90, you can see there is a pronounced trough aloft over California, complete with its own, closed low-pressure center—right over the accident site. The contours on the chart show where the 500-millibar pressure levels (about 18,000 feet msl) are at the same height, which is why they’re called height contours. The converging winds circulating around that closed low impart weak lifting to the air below it, and so do the cold, minus 25 degree Celsius temperatures at altitude. (Surface temperatures in the area were in the low 50-degree Fahrenheit range.) By the way, this upper-level trough persisted from the 850-millibar (5,000-foot) all the way to the 300-millibar (30,000-foot) level. And although the trough and closed low was deep, winds around them were light. With a situation like this, the low pressure system and its clouds and precipitation won’t be moving away any time soon.
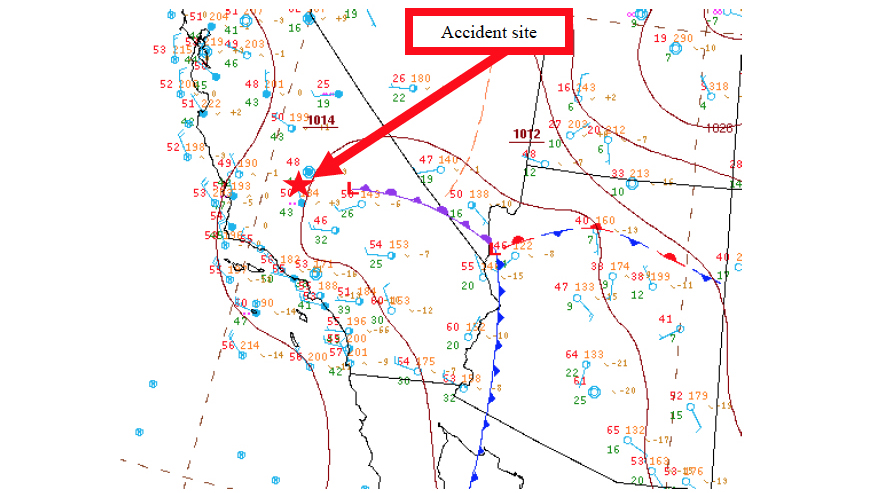
What about conditions at the surface? The surface analysis chart on page 91 (top) for the time near the crash shows a low over the Las Vegas area, with an occluded front running to the northwest, a cold front extending to the south, and a dying stationary front curving to the east. Like the winds aloft, winds at the surface were weak. At the nearby Porterville (California) Municipal Airport, winds were calm, visibility was 10 miles, and the sky was 3,800 scattered, 5,500 overcast. Temperature and dew point were 9 and 6 degrees Celsius, respectively.
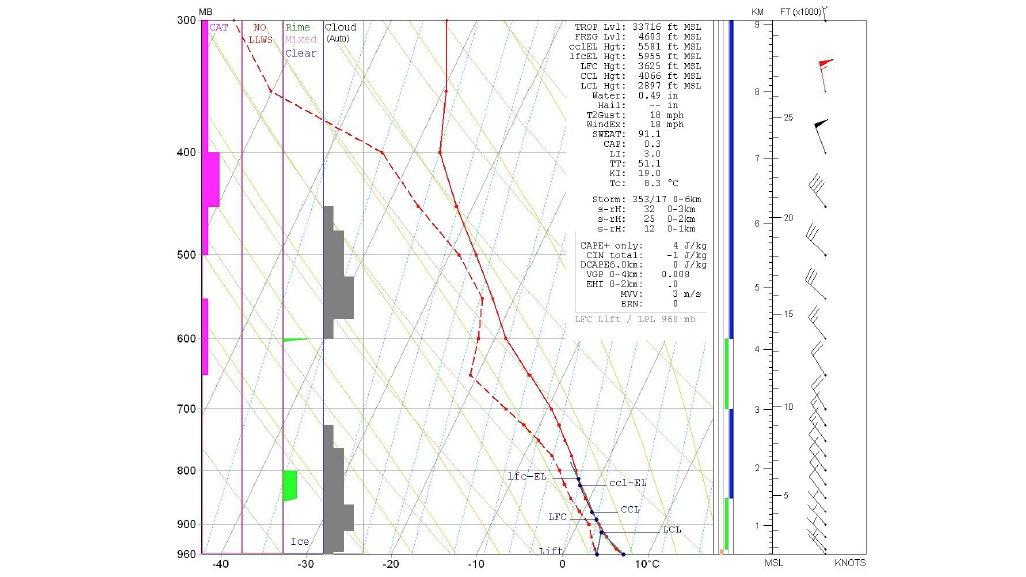
A look at the Skew-T/log P (sounding) chart on page 91 (bottom) near the time of the crash shows several items of interest in the atmosphere’s vertical profile. The upward slanting line on the right is temperature; the one on the left is dew point. Based on the closer temperature/dew point spreads, dense cloud was analyzed from the surface to 10,000 feet. Investigators looked at radar imagery and analyzed likely icing conditions from 5,000 to 7,000 feet.
Bottom line? This is a deep, slow-moving low-pressure system bringing moist oceanic air inland, and lifting it into progressively colder-than-standard air aloft. It’s certainly not a convective system, but one that’s very conducive to IMC and low-altitude icing. West Coast pilots: If you see a winter pattern like this, you might want to delay your flight. Come to think of it, no matter where you’re flying, any closed lows showing up at 500 millibars or higher can be trouble.
Email [email protected]