
Opinion: Big data secrets
Why the wind’s on your nose and your cylinder runs hot

The late Bob Blodget, senior editor of Flying magazine, captured how most pilots feel about this when he wrote that “we all come to the conclusion that there are always more headwinds than tailwinds; and that the headwinds are always stronger than reported or forecast, and the tailwinds weaker.”
Blodget wrote those words in 1968. In his time, we could only speculate about such things. But in today’s era of computerized avionics and big data, we can prove them.
My colleague Chris Wrather is a longtime friend, pilot, Bonanza owner, and A&P mechanic with a Ph.D. in operations research. Among other things, he oversees the SavvyAnalysis division of my company. Over the past four years, we’ve built a database of digital engine monitor data comprising more than a million flights by about 7,000 piston-powered general aviation airplanes.
Digital engine monitors typically capture data from myriad sensors between 10 and 60 times a minute. This means that for each of those million-plus flights, we’ve captured tens of thousands of data samples involving dozens of parameters. Lately, Chris has been doing interesting research using this big data. When I mentioned the old more-headwinds-than-tailwinds conjecture to him, he decided to do some number crunching to see if he could prove or disprove it.
The deck is stacked
Later, he shared with me the results of his study of about 3,500 flights of late-model Cessna 182S Skylanes powered by Lycoming IO-540 engines. Chris said he chose this particular cohort for this study for two reasons: First, the Skylane cruises at a modest 140 knots, so the effects of headwinds and tailwinds should be greater than for faster aircraft. Second, every 182S is equipped with Garmin G1000 avionics that capture both true airspeed and groundspeed, precisely the two parameters he wanted to study.
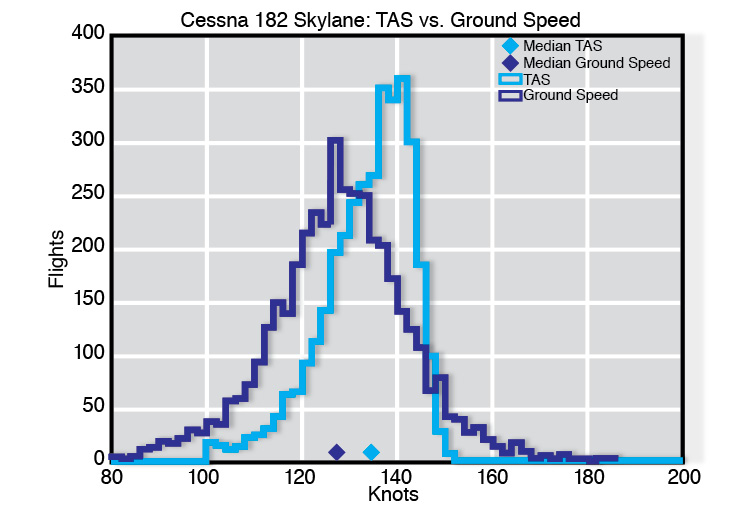
Chris wrote software to analyze data from these 3,500 Skylane flights, locate the longest stable cruise segment of each flight, calculate the average true airspeed and groundspeed during those stable cruise segments, and plot those values and calculate the median true airspeed and groundspeed.
As the chart Chris sent me (next page) demonstrates, the median groundspeed was 7.5 knots slower than the median true airspeed. This means that if you fly a 140-knot Skylane, the deck may be stacked against you by more than 5 percent! (Compare that with the “house edge” in Las Vegas blackjack or video poker, each of which is less than 0.5 percent.)
I’d always attributed this phenomenon to the obvious fact that we spend more time in headwinds than in tailwinds because the flights into headwinds are slower and take longer, while the ones with tailwinds are faster and finish more quickly. While that’s true enough, it doesn’t explain the results of Chris’ Skylane study. His analysis looked only at the average true airspeed and groundspeed, and ignored the length of the flights. (If he’d used time-weighted averages, the results would have been far worse.)
So, what exactly is going on here? Here’s how Chris explained it to me:
Imagine you’re cruising on a constant heading on a CAVU day. Visualize dividing the horizon into two 180-degree arcs, one extending 90 degrees to either side of the airplane’s nose and the other extending 90 degrees to either side of the airplane’s tail.
We might define wind blowing from a direction within the forward arc as a “headwind,” wind blowing from a direction in the aft arc as a “tailwind,” and wind blowing from exactly 90 degrees to our track as a direct crosswind (neither a headwind or a tailwind). We might go further and postulate that if wind direction relative to our track is randomly distributed around the entire 360-degree horizon, we would expect the likelihood of having a headwind or tailwind to be a toss-up.
But this mental picture is simply wrong unless the wind is negligible. Here’s why:
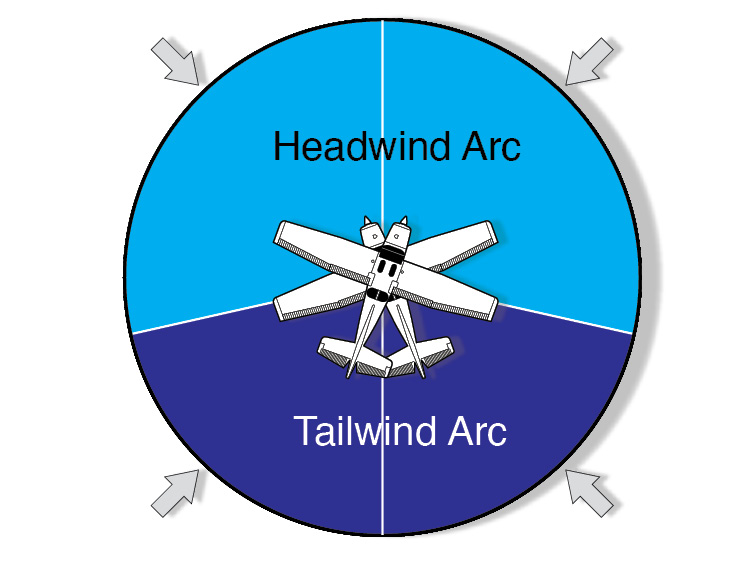
If the wind aloft is significant and blowing from 90 degrees to our track, we must crab into the wind to maintain that track. Crabbing into the wind reduces our groundspeed, transforming what we thought was a direct crosswind into a headwind. The wind direction would have to shift noticeably aft of the 90-degree point before it changes from a headwind to a tailwind (top right).
Thus if the wind is significant compared to our true airspeed, the forward “headwind arc” is more than 180 degrees and the aft “tailwind arc” is less than 180 degrees, causing headwinds to be more likely than tailwinds. The stronger the wind is, the more pronounced this effect is. This explains the 7.5-knot difference revealed by Chris’ Skylane study, and confirms what we pilots have long suspected about the deck being stacked against us.
Airspeed Comparison
Real-World Wind Arc
CHT studies
We’ve used our “big data” repository to do lots of other interesting studies, too. Some have focused on what I consider to be the most important factor affecting engine reliability and longevity: cylinder head temperature (CHT).
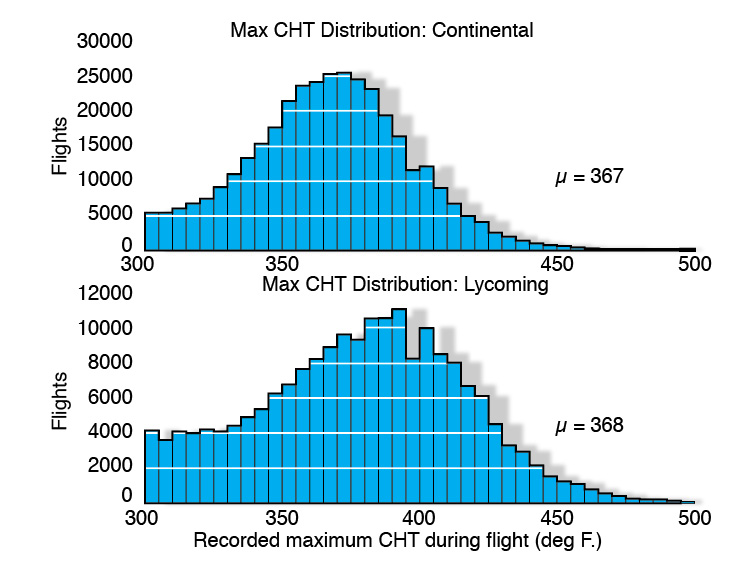
For example, I’ve long noticed that Lycoming engines seem to run hotter cylinder head temperatures than Continentals, and I wanted to see if we could verify and quantify that. Chris crunched the numbers from several hundred thousand flights and came up with the following results:
Data demonstrated clearly that Lycoming cylinder head temperatures do indeed run a good 20 degrees F hotter than Continental cylinder head temperatures (see Figure 3). There are some good engineering reasons for this, notably the fact that Lycomings use sodium-filled exhaust valves that transfer heat from the valves to the cylinder heads more efficiently than do Continental valves. Fortunately, Lycoming cylinders employ a head-to-barrel junction design that can handle higher temperatures, which is why Lycoming sets its CHT redline at 500 degrees F, compared to Continental’s more conservative 460 degrees F.
One interesting aspect of this study that had me puzzled was the odd-looking double peak on the Lycoming cylinder head temperature histogram. Drilling down further into the data revealed that the Lycoming IO-360 series was responsible for the double peak. It turns out that Lycoming originally spec’d the IO-360 ignition timing at a rather aggressive 25 degrees before top dead center (resulting in hot cylinder head temperatures), and then later changed its mind and retarded the timing to a more conservative 20 degrees BTDC (resulting in much cooler cylinder head temperatures). It appears that there is now a mix of IO-360s in the field—some timed to 25 degrees and some to 20 degrees—accounting for the double peak.
CHT Distribution
Cessna 210 CHT Spread
Cirrus SR22 CHT Spread
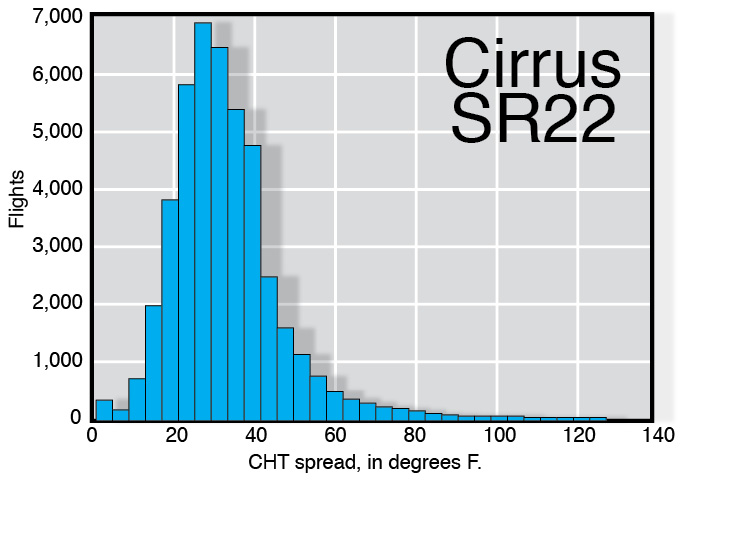
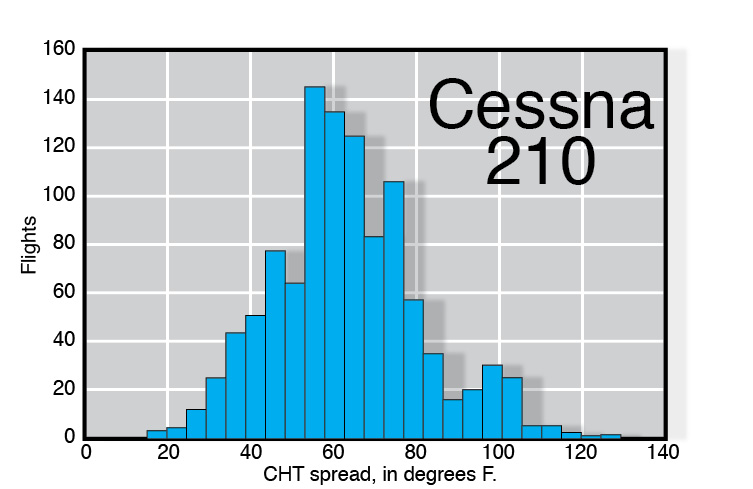
Another thing I’ve noticed is that piston airplanes designed in the past 20 years or so have much more efficient cooling systems and much more even cylinder head temperature distribution than legacy aircraft. To find out just how much more efficient, we compared normally aspirated Cirrus SR22s and Cessna 210s, looking at the spread between the hottest and coolest cylinder head temperature (this page).
The modern cooling system design of the SR22 provides much tighter cylinder head temperature spreads than the 60-year-old design of the cooling system in the Cessna 210. Drilling down further, it’s clear that the 210 cooling system’s problem is systemic, not random: The left (even-numbered) bank of cylinders has much better cooling than the right (odd-numbered) bank, and the right-front cylinder (number 5) is almost always the hottest-running problem child. That suggests a fundamental design issue with the 210’s cooling system. Conventional wisdom holds that the problem is related to number 5 being right behind the engine’s right-front-mounted oil cooler, making it difficult to obtain adequate cooling air. (More recent engine designs from Continental relocate the oil cooler to the back of the engine, behind cylinder number 2.)
This is just a taste of some of the cool results that can be obtained by mining and analyzing big data from piston GA aircraft. I estimate that roughly 50 percent of the piston GA fleet is equipped with recording digital engine monitors capable of capturing real-time engine and flight data for analysis. The potential benefits of collecting and studying this data are enormous.
Sadly, however, the overwhelming majority of captured data is never extracted for analysis, and winds up in the proverbial bit bucket, forever lost. It amazes me how many aircraft owners have fancy data monitoring equipment but have never retrieved the recorded data and don’t even know how. One of my challenges is to convince aircraft owners to dump their captured data for analysis on a regular basis, much as they have oil filters inspected and oil samples sent to the lab. My hope is that the next generation of avionics will be able to “phone home” autonomously over the internet.
Analysis of big data isn’t limited to studying groups of aircraft. By comparing data obtained from one particular aircraft against data from a cohort of similar aircraft, it’s possible to provide important actionable information to aircraft owners. Software can automatically detect exceedances and outliers, and identify mechanical and operational problems that might otherwise go undetected. More about this next month.
Email [email protected]


