IFR Fix: Frozen in time
When a January storm roared through the Northeast up into New England, a glance at a radar summary and a surface weather chart showed that conditions were treacherous and changing fast.
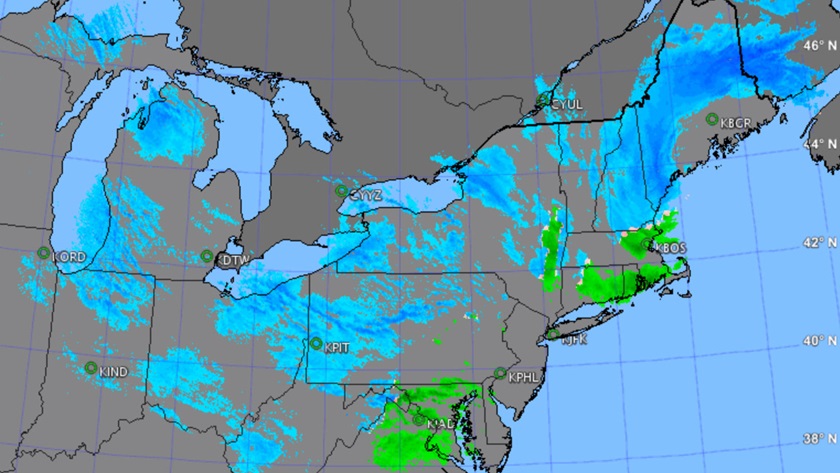
With the low directly positioned over northern New England, dense snow bands circulated counterclockwise around its center. In what seemed like a precip-free zone away from those snowy bands, surface conditions were anything but quiescent: KBGR 091821Z 01008KT 1SM R15/4500V5500FT -SN BR OVC005 01/01 A2907 RMK AO2 SFC VIS 1 1/4 RAB01E14SNB14.
Icing-probability forecasts aren’t always as slam-dunk as a winter storm. Given that for most general aviation pilots, avoidance is the only icing strategy, we rely on three icing elements in current reports and forecasts: probability of icing, severity, and the potential for SLD (supercooled large drop precipitation). According to the National Weather Service’s Aviation Weather Center, SLD includes freezing drizzle and freezing rain—two of the most dangerous conditions a light aircraft might encounter.
An informational page about the Aviation Weather Center’s icing forecast information discusses two products: its Current Icing Product (CIP) that provides “an hourly, three-dimensional diagnosis of the icing environment,” and the Forecast Icing Product (FIP). Icing severity is rendered in five categories: none, trace, light, moderate, and heavy; SLD potential is depicted as red hatching.
Probabilities come with margins of error, however, and can produce an occasional outlier result. When a Cessna 182 with an iced-over windshield stalled while landing at Wisconsin’s Green Bay-Austin Straubel International Airport on Jan. 11, 2017, the National Transportation Safety Board reviewed the area’s weather data, concluding it “revealed no probability of icing at the reported time and altitude of the encounter and only about a 10% chance of trace icing during the hour following the encounter.”
The CIP “showed no icing at 3,000 ft. msl,” while the one-hour FIP at 3,000 feet msl, “showed the icing severity as trace ice, an icing probability of about 10%, with the supercooled liquid drop potential as unknown.” Probabilities were higher at 5,000 feet, but still no more than 50 percent, the NTSB said.
The narrative also reminds us that an icy airplane is an unpredictable airplane: It was after the pilot deployed flaps 30 feet above the runway that the airplane stalled and dropped in.

Related Articles


