Proficiency: There’s a chart for that
Can you make the climb?

I am a designated examiner for the Nashville Flight Standards District Office, and although most private pilot candidates still arrive for the practical exam with paper charts, instrument rating candidates almost never do. That’s fine, but recently I gave a practical exam that reminded me of a convenient reference in paper U.S. Terminal Procedures Publications.
I asked my instrument rating candidate, John, to plan a flight from Tennessee’s Winchester Municipal Airport to Asheville Regional Airport in North Carolina. The scenario conditions at Winchester included 8 miles visibility, a 300-foot overcast cloud layer, winds from 150 degrees at 4 knots, and his aircraft was at maximum gross weight. Although John said his personal weather minimums for a ceiling were greater than those, we continued with the scenario as a thought experiment.
The Winchester Airport is at 978 feet msl and Memphis Center often cannot see an aircraft on radar in that area until it has reached 3,500 feet msl, so the controllers cannot assist with terrain avoidance. I asked John, “How can you guarantee that you will avoid obstacles on your departure from Winchester?” John wisely consulted the obstacle departure procedure for the airport. For Runway 18, the minimums are standard with a climb of 330 feet per nautical mile to 2,400 feet msl. John said that on such a day his airplane can easily climb 550 feet per minute so we should be fine. The problem is that he was comparing a climb gradient (feet per nautical mile) to a climb rate (feet per minute). My raised eyebrows made John rethink his statement, and he recognized the inconsistency.
John had correctly determined that, given the field elevation, local altimeter setting, temperature, and aircraft weight, his aircraft was capable of a 550-fpm climb rate. In order to see if this was sufficient, he needed to convert the 330-feet-per-nautical-mile climb gradient to a climb rate, and for that he needed two other items: the true airspeed during the climb as well as the winds. In other words, he needed to know the groundspeed during the climb to altitude. John used a climb speed of 80 knots but assumed it would be 90 knots to err on the side of caution.

Now John was ready for the conversion. He said, “Hmmm, now there is a chart for that,” and proceeded to search his iPad for it. The paper approach plate books always included this handy chart, and even though the approach plates were downloaded onto his iPad, his search for the chart yielded no results. After fumbling with some mathematical calculations, he finally estimated that he would need a climb rate of about 495 fpm to achieve the desired climb gradient—he was good to go but it was a lot closer than he would have guessed to the 550 fpm of which his airplane was capable. That made an impression on him.
As an examiner, I am aware that earning the instrument rating in a flatter part of Tennessee means that you are legal to depart an airport such as Steamboat Springs in instrument meteorological conditions. There, the takeoff minimums on Runway 14 require a climb gradient of 610 feet per nautical mile to over 2,000 feet above the airport elevation of 6,882 feet msl. It would be easy to find days for which this isn’t possible in many general aviation aircraft. Confusing climb gradient and climb rate in this case could prove disastrous.
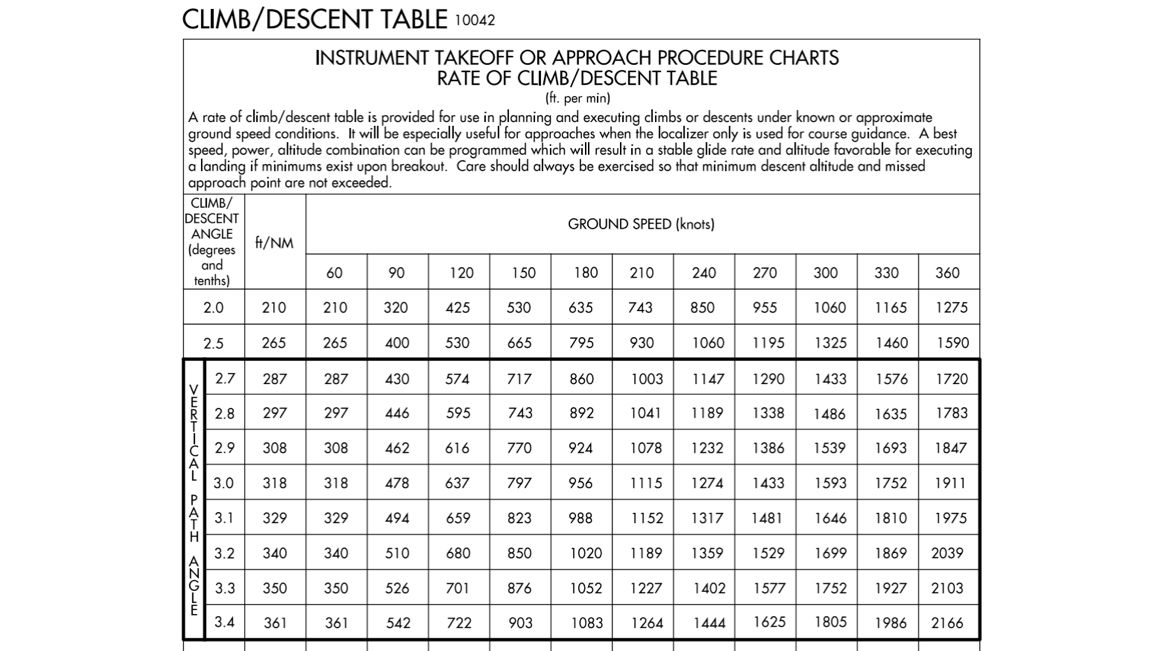
After the exam ended, I pointed out to John that he can download the Digital Terminal Procedures Supplement for free from the FAA website and keep it on his iPad. (The supplement also may be downloaded via some apps.) The last page of the document features the climb/descent table. Why spend time rediscovering a formula when this chart is all one needs to understand the relationship among climb angle, climb gradient, and climb rate?
The climb/descent table facilitates descent planning. Determining the descent rate that results in a given descent gradient on an instrument approach is important. The Instrument Rating Airmen Certification Standards (ACS) require that a pilot reach the missed approach point at an altitude between 0 and 100 feet above the minimum descent altitude. Descending too gradually may mean that you end up high on the approach and needlessly perform a missed approach procedure.
The VOR 36 approach into Shelbyville Municipal Airport requires a descent angle of 3.26 degrees after the final approach fix, BOMAR. The balancing act is to use a descent rate that results in a stable approach but is high enough to get down close to the minimum descent altitude by the missed approach point. Assuming an approach groundspeed of 100 knots, the climb/descent table indicates that a descent rate of at least 584 fpm is necessary to arrive at the visual descent point on this approach. I often ask that candidates shoot the Shelbyville VOR 36 as a circling approach, as one is required in the ACS. Beyond the dangers of maneuvering at low altitude around an airport in poor weather conditions, circling approaches tend to involve tailwinds, and that means even higher descent rates are necessary. With a 20-knot tailwind, the descent rate would be at least 701 fpm between BOMAR and the visual descent point.
Two mistakes I see frequently during instrument rating practical exams both arise from not connecting climb and descent rates to climb and descent gradients correctly. Without the paper approach plate books, the climb/descent table takes an extra step to find. I keep a laminated version of the table on my kneeboard as well as in the Documents section of my ForeFlight app. When planning a flight or briefing an approach, I like to make the calculations quickly and accurately. Thankfully, there is a chart for that.AOPA
Catherine Cavagnaro owns Ace Aerobatic School in Sewanee, Tennessee, (www.aceaerobaticschool.com) and teaches at Sewanee: The University of the South.


