WX Watch: Winter storm Avery
Scoping out a November nor’easter

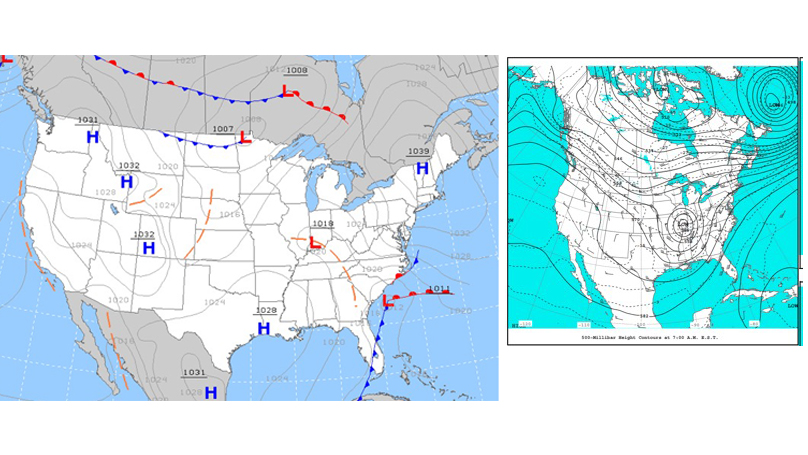
 Like the crew of the ore boat’s song, pilots also anticipate the first ice of the winter season with concern. This winter, snow came to the eastern United States relatively early, when winter storm Avery—so dubbed by The Weather Channel—developed November 13 to 14, 2018. (the National Weather Service does not name winter storms.) Avery was created by a large trough aloft, the lifting forces of its associated jet stream winds, and its consequent surface low pressure systems. It was a double-barreled system. In its first phase a surface low affected the Deep South, spreading snow and ice pellets as far south as Louisiana and Mississippi before moving into the Ohio Valley. Then, as the trough and its surface low moved east, it helped form another surface low just north of the Bahamas. This low would prove to be the most influential.
 The low over the ocean was no tropical depression or hurricane. Sea surface temperatures were too cold for that. Besides, the circulation around this low was open, so it drew in colder air from the north and warmer air to its south, creating the cold and warm fronts that gave it the familiar look of a classic frontal model. In other words, its circulation wasn’t closed like that of a tropical storm or hurricane, so it didn’t have an isolated, “warm core” central area of low pressure.
To the north of this low was a high pressure system. If you think of the flows around highs and lows, you can see how trouble was brewing for the nation’s northeast quadrant. The counterclockwise flow around the oceanic low was bringing warm, moist air north in its warm front. The clockwise flow around the high over southern Ontario, Quebec, and northern New England was sending cold air to the south. The oceanic low’s warm front began riding up and over the cold, dense, sinking air from the northern high as it moved toward the Cape Hatteras area. And while the warm front’s surface location may have been running to the east of the Cape, its shallow slope brought warm air aloft as far north as Pennsylvania and New York state by November 15.

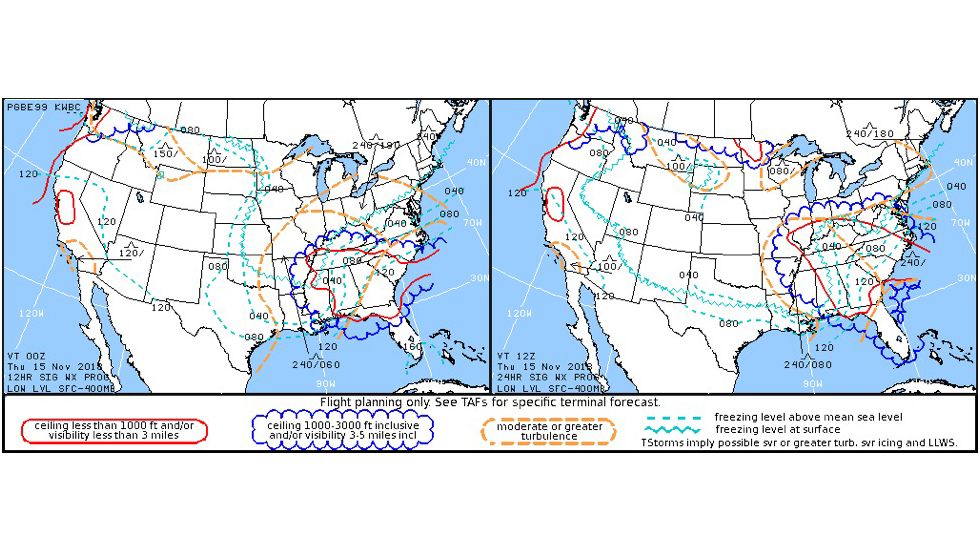
Were there any airmets or sigmets? You better believe it. Moderate icing prevailed in clouds reaching 20,000 feet in layers, moderate or greater turbulence was the rule, and low (ceilings below 500 feet, visibilities below one mile) instrument meteorological conditions in rain, snow, and freezing rain covered much of the mid-Atlantic and Ohio Valley. This whole mess—and it covered entire states—was tracking toward New England.
Temperatures aloft were critical. Remember, with a warm front, warmer air (a relative term) lies over cold. Any precipitation from the warm frontal surface aloft will fall into that colder air. If that colder air is below freezing—and in winter systems, it usually is—then the result is snow, ice pellets, or freezing rain. It all depends on how long the falling precipitation spends in subfreezing temperatures on the way down. If the precipitation is in subfreezing air all the way to the surface, then snowfall occurs.
But what if it falls through layers of warmer, then suddenly subfreezing air? Then snow can melt into ice pellets (aka sleet), graupel (where supercooled water droplets freeze on snowflakes, making snow pellets), or freezing rain. That is exactly what happened with Avery in the mid-Atlantic. In many locations, there was a layer of above-freezing temperatures at 2,000 to 5,000 feet msl, and beneath it a subfreezing layer hugging the surface. This is the classic recipe for freezing rain.
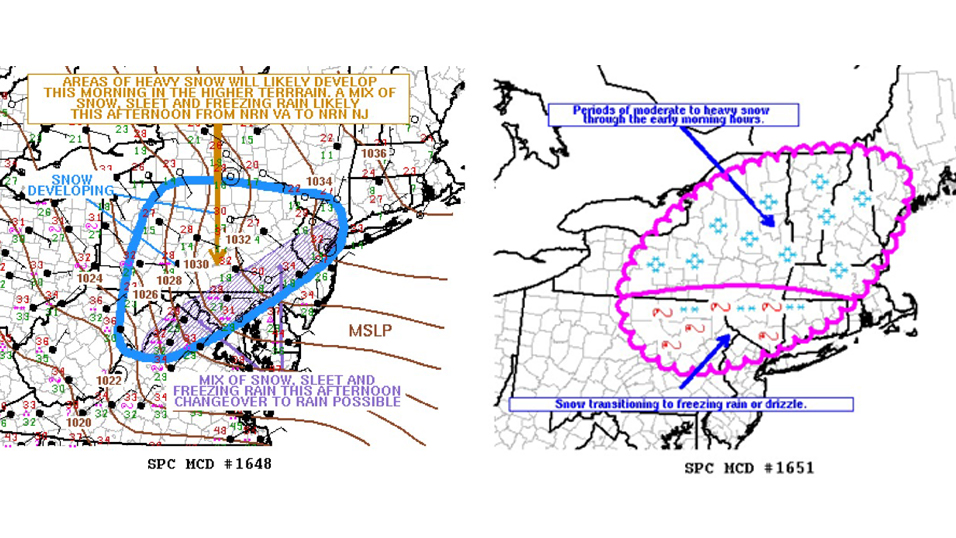
As Avery moved north, the National Weather Service updated significant events through its mesoscale discussions (MDs). There were plenty during this storm’s trip through the eastern United States, and no pilot would want to fly through areas affected by any of them. You can check for any mesoscale discussions at the Storm Prediction Center website. Click on the “SPC Products” dropdown menu, then select Mesoscale Discussions. MDs are worth checking during any preflight briefing—and they are posted all year, not just the winter months. Sure, their text portions include some meteorological jargon, but together with their accompanying chart illustrations they can help you understand storm dynamics. In Avery’s case, after a quick glance at MDs and the Aviation Weather Center’s Current and Forecast Icing Potential charts, you instantly know you should fly another day.
Email [email protected]


