The 'Big H' and 'Big L' Dynamic
Low- and high-pressure flows and fronts
By Thomas A. Horne
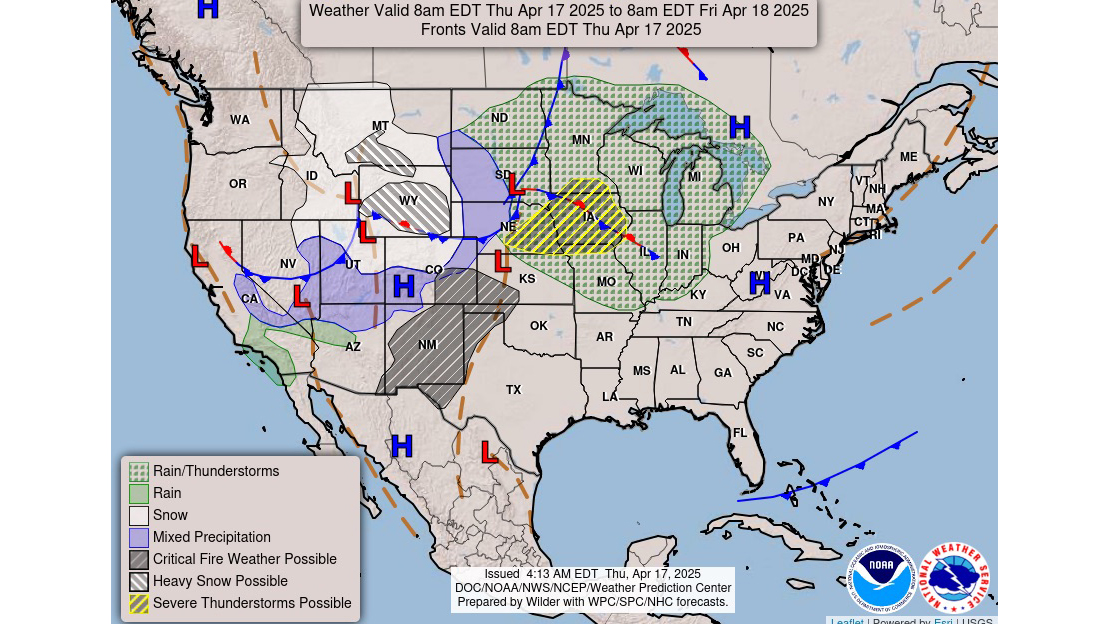
Checking the big-picture weather situation should be the first of your preflight briefing chores. In particular, you want to know where those big red “L” and blue “H” symbols are located on surface analysis charts. These indicate centers of low- and high-pressure systems, respectively—and they have everything to do with the conditions you can expect along your route.

Checking the big-picture weather situation should be the first of your preflight briefing chores. In particular, you want to know where those big red “L” and blue “H” symbols are located on surface analysis charts. These indicate centers of low- and high-pressure systems, respectively—and they have everything to do with the conditions you can expect along your route.
Let’s look at low pressure systems first. As we’ve all been taught, low pressure is an indicator of adverse weather. Caused by pressure patterns aloft, lows nearer the surface draw surrounding air masses toward them. This convergence occurs at the same time the air masses begin to rotate in a counterclockwise pattern around that big red “L.” With no place to go but up, all that converging air rises. Now the trouble starts.
The low’s rising air causes atmospheric pressure to drop, and the more the air rises, and with enough moisture, air masses condense into clouds that can rise to become thunderstorms, either singly or in lines or clusters.

A lot depends on the location of the central low pressure and the nature of the air being drawn into the system. A low parked over the Midwest brings warm, juicy air from the Gulf of America (formerly the Gulf of Mexico) to the south, as well as colder, drier air from the west. Where these two differing air masses collide, a cold front can form. The cold front typically extends to the south or southwest and can be a great place for heavy rains and other adverse weather conditions to form and mature. That’s because cold fronts are caused by cooler, denser air wedging itself beneath warmer air. It can be an aggressive clash if the temperature differences across the frontal zone are great, moisture is plentiful, and the fronts are fast-moving. Don’t be surprised if convective sigmets crop up.
Meanwhile, warm fronts can form along an axis to the east of a low-pressure center. Here, on southerly winds, less dense, warm air rides up and over colder air to the north. Widespread cloud layers often occur, as well as instrument meteorological conditions and thunderstorms. Again, another place for scrutiny as you fly. A 180-degree turn may be a good strategy. Or waiting it out for a day or so.

If lows are rude and angry, then high pressure is usually more docile. Big “H” country works just the opposite of low-pressure systems. Highs bring descending air that warms on its way down, spreading out and flowing in a clockwise direction. This has a drying effect, which can inhibit clouds and precipitation. However, there are always exceptions. A high’s warm temperatures can heat up the surface enough to create air mass thunderstorms. Sometimes, sometimes, you can weave your way around air mass cloud formations. Here’s where datalink radar imagery, flight following (VFR advisories) from ATC—and, above all, maintaining visual separation—are vital.

Bear in mind that large high-pressure systems have “front side” and “back side” weather. The front side is east of the “big H” and can be an area dominated by turbulence as cold air out of the northerly points of the compass is made buoyant by the ground warmed by the preceding weather system. The back side—to the south and west of the “big H”—is a region with warm, moist southerly winds. Here, there’s the potential for convective weather, typically fed by flows from the Gulf or western Atlantic Ocean.
As you might suspect, there’s a cyclical aspect in the interaction between high- and low-pressure systems. The cold, northerly flows off the front side of a high may create or intensify the cold fronts emanating from a preceding low pressure system. And those warm, wet flows off the back side of a high feed into the warm sector—and warm front—preceding a successor low. Study surface analysis charts for a week or so and you might just see how much the tango between highs and lows may sway your go/no-go decision making.
Thomas A. Horne is a former editor at large for AOPA media and the author of Flying America’s Weather.


