Quantifying maintenance risk
Are GA airplanes more dangerous to fly during the first hours after maintenance?

The principal assignment of Waddington and his fellow scientists in the Coastal Command Operational Research Section was to advise the British military on how it could more effectively combat the threat from German submarines. Among other projects, Waddington and his colleagues were tasked with improving the dispatch reliability of two squadrons of B–24 Liberator submarine hunters based at Ballykelly, Northern Ireland, consisting of approximately 40 aircraft. At any given time, only about 20 of these were flight ready, with the rest of them undergoing maintenance or waiting for repair parts.
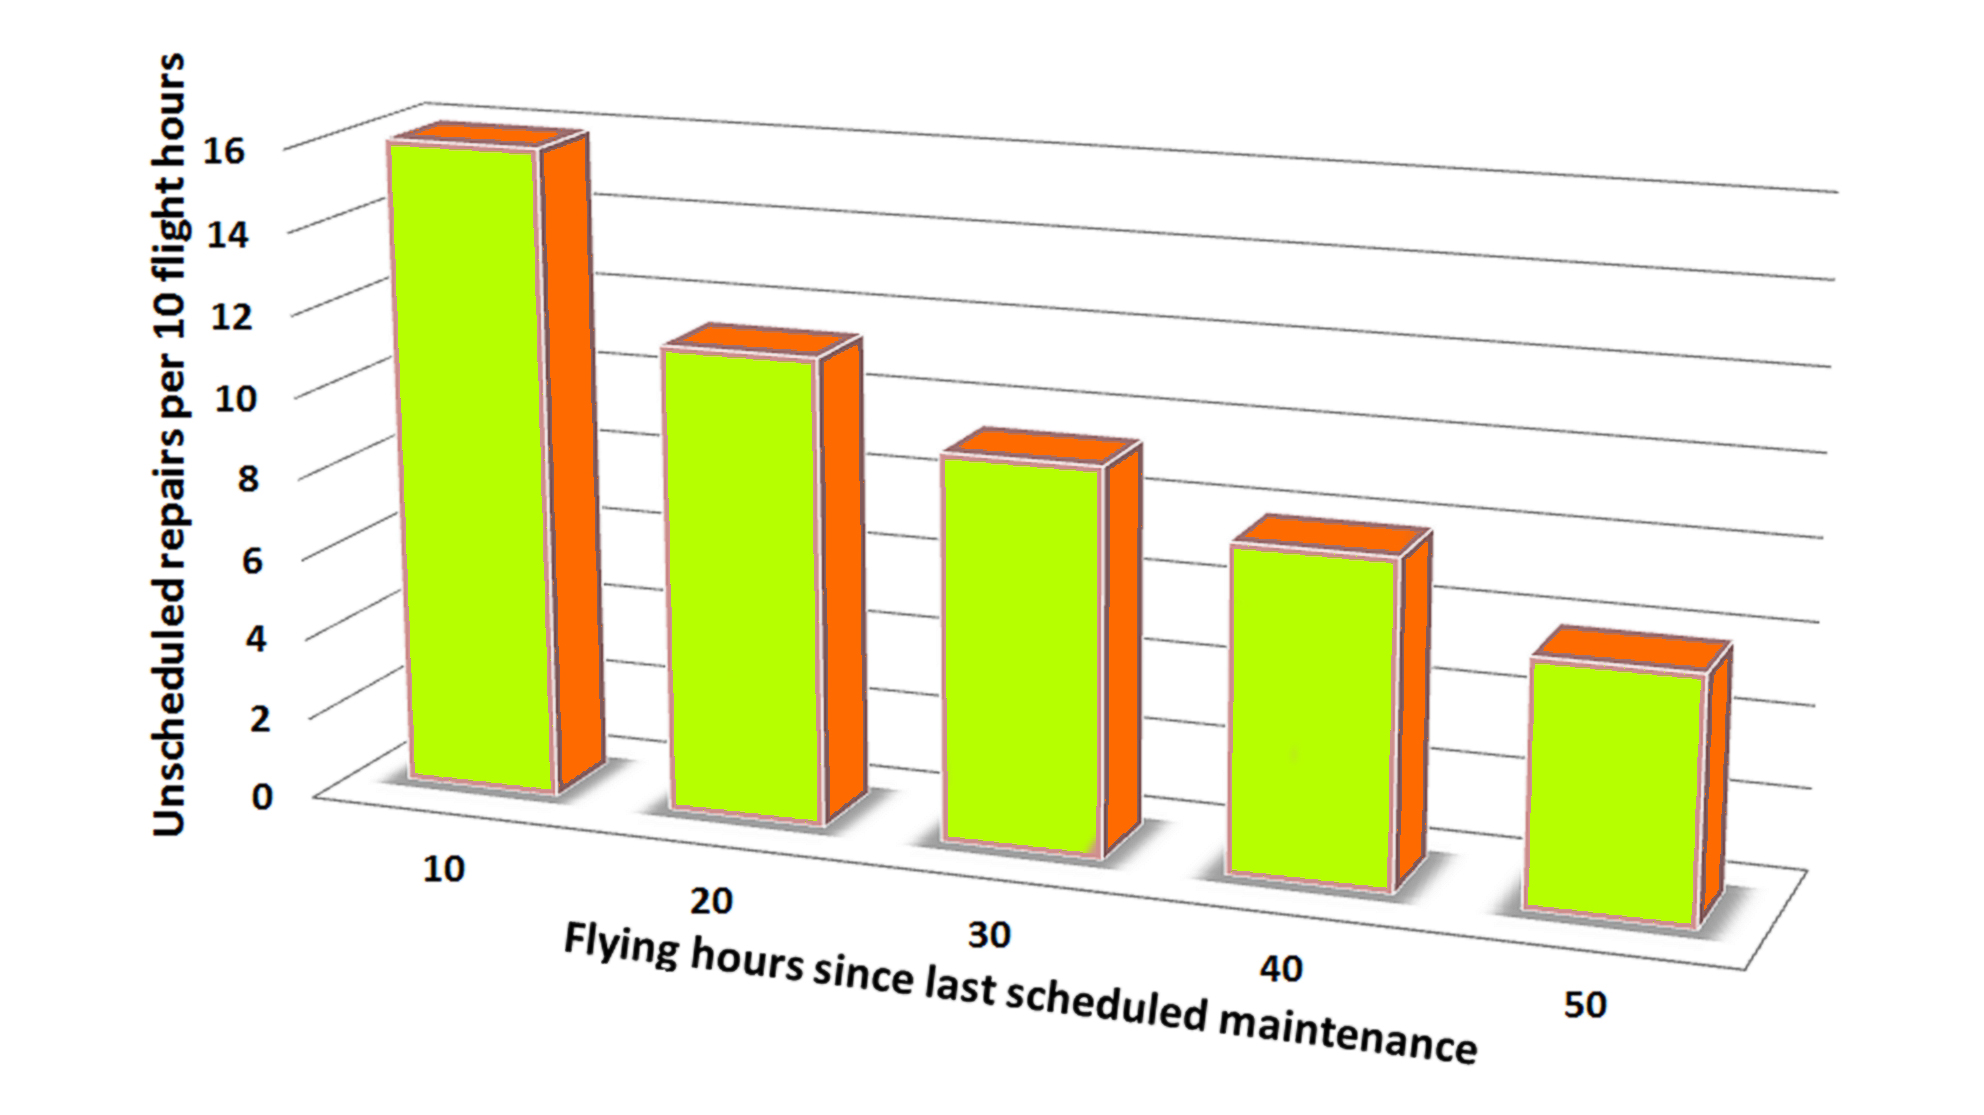
Waddington and his team started gathering data about the scheduled and unscheduled maintenance of these aircraft. When they plotted the number of unscheduled aircraft repairs as a function of flight time, they discovered something unexpected: Whenever these aircraft came out of 50-hour maintenance, the number of mechanical squawks increased sharply, then declined steadily over time until the next 50-hour maintenance, at which time they spiked again. This phenomenon became known as “the Waddington effect” and resulted in a recommendation to the RAF that the 50-hour maintenance interval be increased and the amount of scheduled maintenance be decreased. When these recommendations were implemented, the number of effective flying hours of the British Coastal Command bomber fleet increased by more than 60 percent.
Two decades later, in the 1960s, this same less-maintenance-is-better phenomenon was rediscovered by two United Airlines scientists—engineer Stanly Nowlan and mathematician Howard Heap—whose research resulted in the concept of reliability centered maintenance (RCM) that is at the heart of today’s airline and military aviation maintenance philosophy. (For more information about RCM and the Waddington Effect, see my 2015 book Manifesto on Amazon or Audible.)
But the research by Waddington, Nowlan, and Heap involved large military and transport aircraft, as did the many researchers who followed in their footsteps. Does this less-is-better maintenance philosophy apply equally to small piston GA airplanes? I’ve been preaching that it does for many years, but my sermons have been largely based on personal experience, anecdotal data, and gut-feeling hunches. Until now.
Quantifying maintenance risk
Recently, I became aware of a February 2025 research paper written by information scientist (and CFII) Daniele Paolo Scarpazza and medical researcher Joseph Anthony Hutter titled Quantifying the Risk of Accidents and Serious Incidents Due to Maintenance in General Aviation that to the best of my knowledge is the first rigorous effort to quantify the safety risk of routine maintenance in piston GA.
The questions Scarpazza and Hutter addressed in their study were “Is it true that piston GA airplanes are at greater risk of having an accident or serious incident during the first hours after maintenance?” and “If so, how much more risky and for how long?” Getting rigorous answers to these questions turned out to be a lot easier said than done.
The researchers analyzed the NTSB’s database of aviation accidents and serious incidents for the 17-year period 2008 to 2024 inclusive. They found a total of 27,958 such events, of which 20,524 involved small piston singles and twins operating under Part 91. Of those, NTSB investigators were able to determine time since last inspection (TSLI) for 16,635 of those events, and those became the focus of analysis.
Each of these 16,635 accidents and serious incidents were coded by the NTSB with one or more causal factors, some related to human errors and others related to aircraft system or component failures. Most events were assigned multiple causes, some human-related and others aircraft-related (e.g., the engine quit, the pilot attempted to turn back to the airport but got too slow and stalled/spun). But some events were blamed strictly on human error or strictly on aircraft failure. Specifically, 579 events were strictly human-caused and 983 were strictly aircraft-caused.
Correcting for low-time bias
When Scarpazza and Hutter looked at the 983 accidents and serious incidents that were strictly aircraft-caused, they found that the overwhelming majority occurred at very low TSLIs—in other words, very shortly after maintenance. But when they looked at the 579 events that were strictly human-caused, they found the same thing!
They soon realized that the cause was that most of the events involved owner-flown airplanes, many of which don’t fly very much between FAA-mandated annual inspections. In addition, flight school and flying club airplanes that fly a lot are typically required to do 100-hour inspections, and so never reach TSLI greater than 100 hours. The NTSB data had a strong sampling bias in which low TSLIs were significantly over-represented for reasons having nothing to do with maintenance-induced failures.
The researchers came up with a clever scheme for dealing with this sampling bias. They postulated quite reasonably that human performance should be independent of TSLI, so strictly human-caused events could be used as a baseline. If the TSLI distribution of strictly aircraft-caused events was more skewed toward low times than the TSLI distribution of strictly human-caused events, the difference between the two distributions would be due to maintenance-related risk. Using this trick and some very sophisticated analytical sleight of hand, Scarpazza and Hutter were able to derive a relative hazard rate comparing the risk of an aircraft-caused event with the risk of a human-caused event as a function of TSLI.
Surprising results
The analysis found that during the first hour after a piston GA airplane flies following its annual or 100-hour inspection, it is 33.8 percent more likely to have an aircraft-caused accident or serious incident than the human-caused event baseline. This declines to 30 percent during the second hour, 27.5 percent during the third hour—sounds like the Waddington effect—and continues to decline hour-by-hour until the risk of aircraft-caused and human-caused events becomes equal after 31 hours TSLI. The risk of an aircraft-caused event continues to decline until 188 hours TSLI where it reaches a minimum relative risk of 43.6 percent below baseline. Then it starts to increase again, reaching parity with baseline at 327 hours TSLI and peaking at 37.1 percent above baseline at 478 hours TSLI.
When they plotted this relative aircraft-caused risk function, they observed that it resembles a classic “bathtub curve” with an early infant mortality period followed by a useful life period, and a wear-out zone. If the analysis methodology of Scarpazza and Hutter is valid and the relative risk curve looks anything like this, it says a lot about about the role of maintenance in the risk of aircraft-caused accidents and incidents.
Conclusions
The most obvious conclusion is that our piston GA airplanes really are more dangerous to fly during the first hours after maintenance, and that the risk of falling out of the sky because of a stupid mechanic trick is higher than doing so because of a stupid pilot trick during the first 30 hours or so after the airplane comes out of its annual or 100-hour inspection, after which the risk of a stupid pilot trick starts to predominate. Surprisingly, the machine continues to get safer (compared to the pilot) for nearly 200 hours before the trend reverses and it starts getting more dangerous again. And the risk of a scary mechanical failure doesn’t rise back to pilot-error levels until more than 300 hours TSLI.
If this represents the same phenomenon as the Waddington effect, the FAR-mandated requirement to reinspect every 100 hours or 12 months actually makes our GA airplanes less safe than they could be if the inspection interval was increased to, say, 300 hours or 24 months. After all, every time we put the airplane in the shop for an annual or 100-hour inspection, we place it back to the beginning of the infant-mortality period where the risk of falling out of the sky due to a mechanical issue is high.
It sure seems like we’re going through this white-knuckle phase a lot more often than we should, doesn’t it? 
 savvyaviation.com
Ask the A&Ps
Mike Busch, Paul New, and Colleen Sterling answer your toughest aviation maintenance questions on our Ask the A&Ps podcast. Submit questions to [email protected].