Non-Commercial Fixed-Wing
General Aviation Accident Data:
Non-Commercial Fixed-Wing
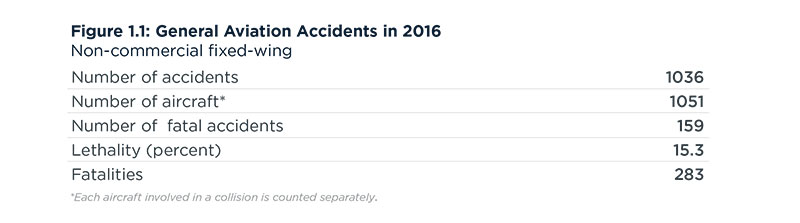
Figure 1.2 shows the 10-year trend data for non-commercial fixed-wing GA aircraft. Following the previous year’s increase, total accidents increased dramatically from 2015 to 2016. In that same time period fatal accidents decreased for the first time in two years to a 10-year low of 159. An increase in flight activity helped mitigate the dramatic rise in total accidents.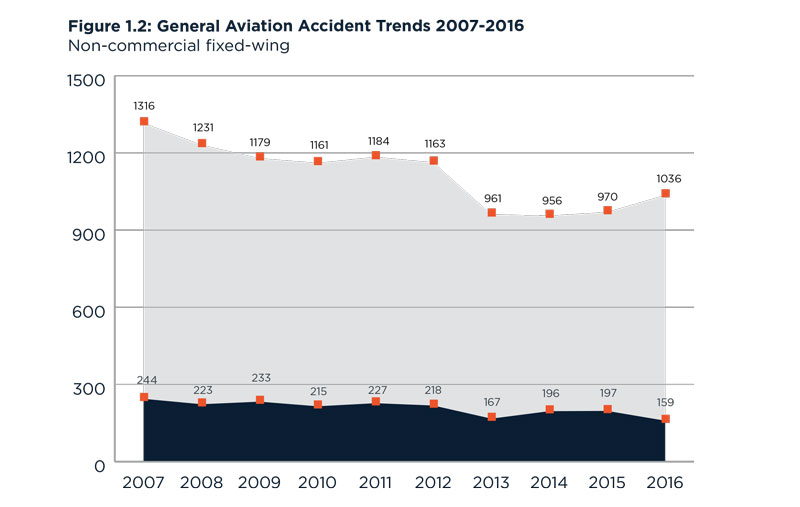
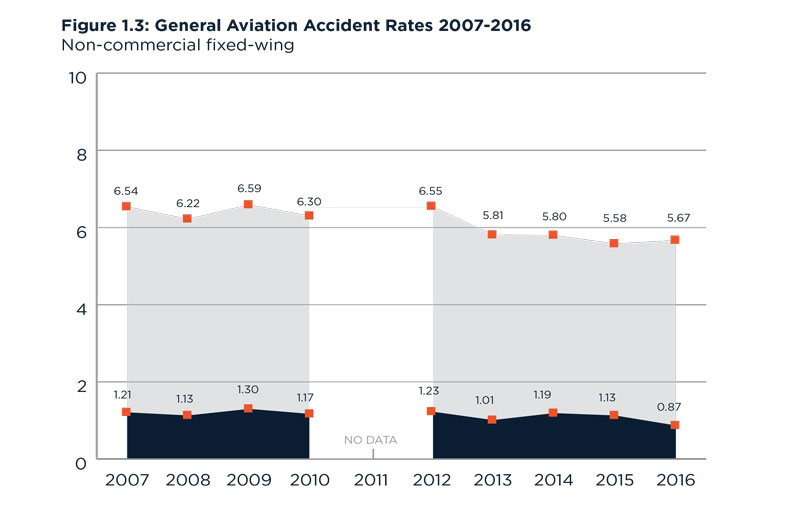
However, flight activity could not overcome the increase in total accidents, breaking a three-year trend, resulting in an increase in the total accident rate. The accident rate for GA non-commercial fixed-wing aircraft increased to 5.67 accidents per 100,000 hours (see Figure 1.3). Flight activity helped drive the downward trend for fatal accidents for 2016 resulting in a fatal accident rate of 0.87 per 100,000 hours. The fatal accident rate, a 10-year low, is the first time non-commercial fixed-wing aircraft have less than 1 fatal accident per 100,000 hours.
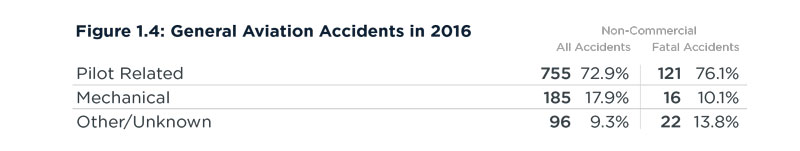
The cause of GA accidents is typically grouped into three broad categories (Figure 1.4):
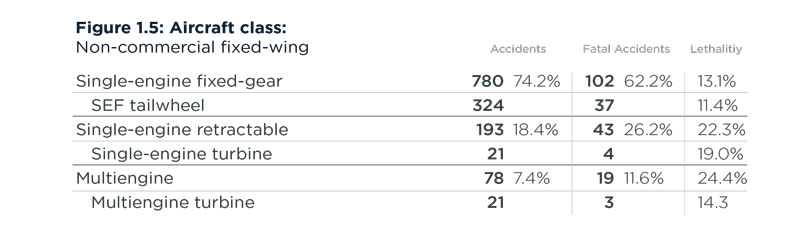
Aircraft Class:
The majority of accidents and fatal accidents were in single-engine fixed-gear aircraft; 780 and 102, respectively. Single-engine fixed-gear accounted for a larger percentage of accidents; however multiengine aircraft have the highest lethality rate (Figure 1.5).
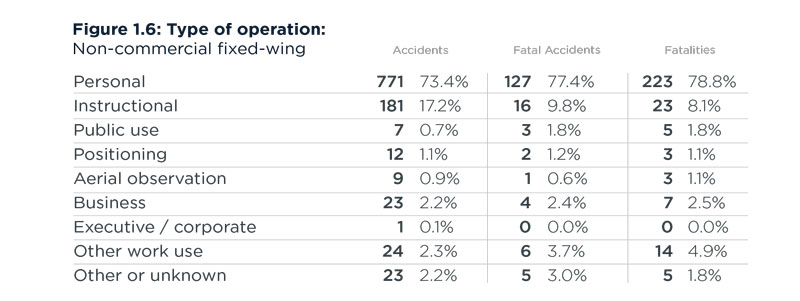
Type of Operation:
Personal flights accounted for 73 percent of accidents and 77 percent of fatal accidents. This relatively high percentage remains stable year to year with only small variability. Instruction flight was again the second highest, accounting for 17 percent of accidents and 10 percent of fatal accidents up from 2015 (Figure 1.6).
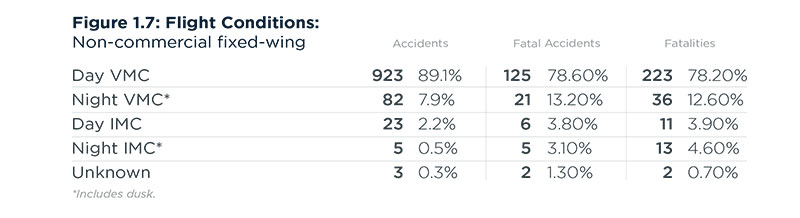
Flight Conditions:
Following a decades old trend, day visual meteorological conditions (VMC) had the largest portion of accidents and fatal accidents, 89 percent and 79 percent, respectively. Night instrument meteorological conditions (IMC) had the highest lethality with all five accidents being fatal (Figure 1.7).
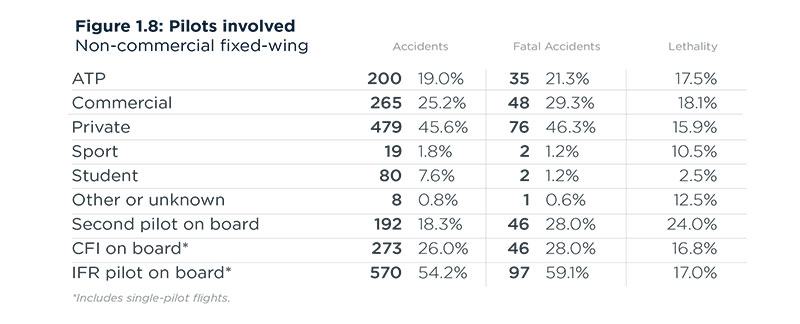
Pilot Qualifications:
Private pilot’s, again, had the highest number of total and fatal accidents, 479 and 76 respectively (Figure 1.8). Additionally, over half of all accident flights had an instrument flight rules (IFR) rated pilot on board. This category remains consistent year to year given that private pilots make up the majority of pilots flying in non-commercial fixed-wing aircraft.
Major Causes
Pilot-related
Accidents arising from the improper actions or inactions of the pilot. As with previous years, pilot-related accidents continue to be the largest factor, accounting for roughly 73 percent of accidents and 76 percent of fatal accidents.
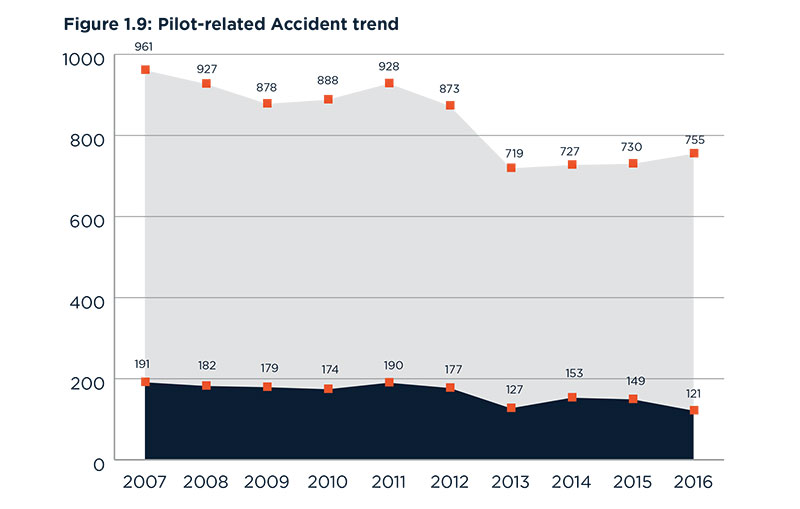
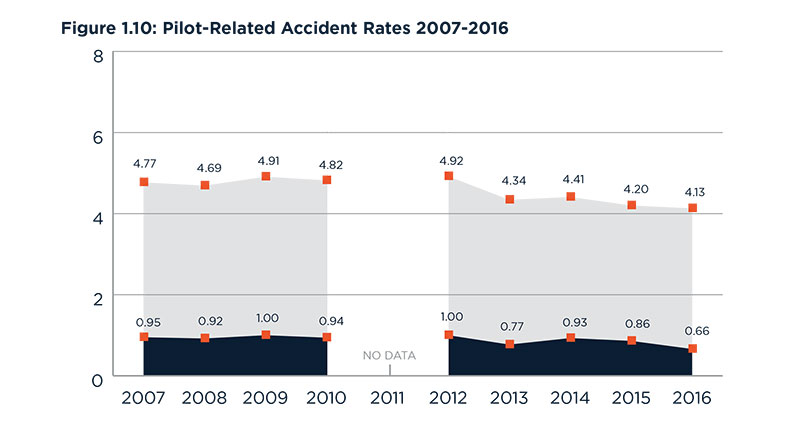
Following a sharp decline in 2013, pilot-related accidents have steadily increased through 2016 (Figure 1.9). With total accidents increasing from 2014 through 2016, fatal accidents decreased to a ten-year low of 121. The increase in yearly flight hours mitigates the increases in total accidents for pilot-related accident rates, which have decreased for the past three years. Fatal accident rates follow the same trend reaching a ten-year low with 0.66 fatal accidents per 100,000 flight hours (Figure 1.10).
Pilot-Related Accidents by Type
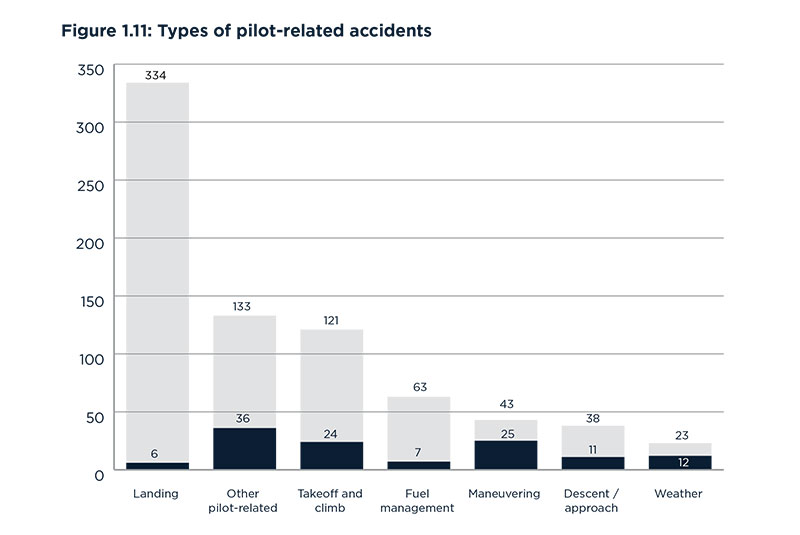
Landing accidents account for the majority of accidents at 334 (Figure 1.11). Other pilot-related accidents had the largest amount of fatal accidents at 36. Maneuvering accidents were the most lethal followed closely by weather accidents at 58 percent and 52 percent, respectively.
Landing accidents
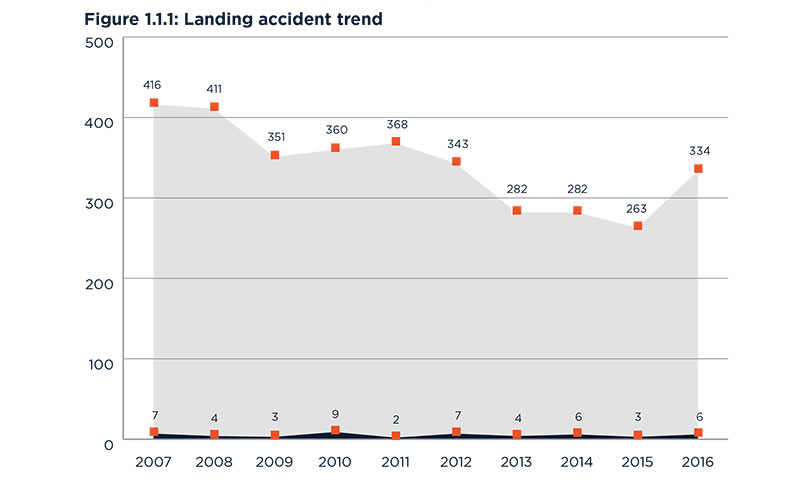
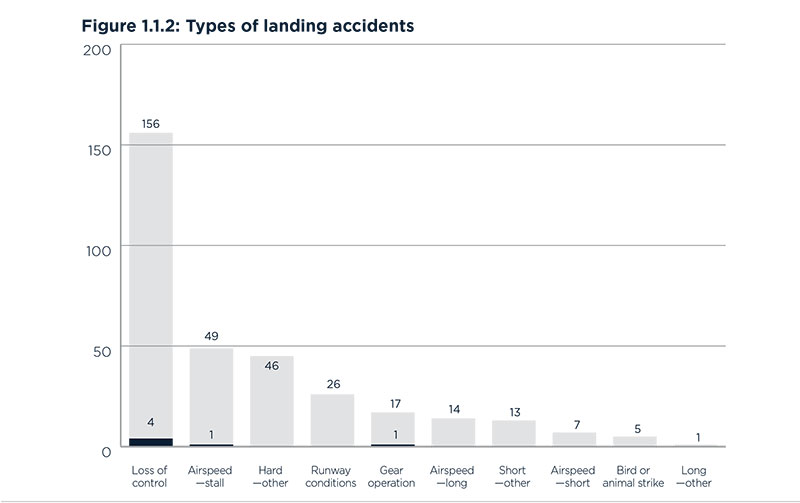
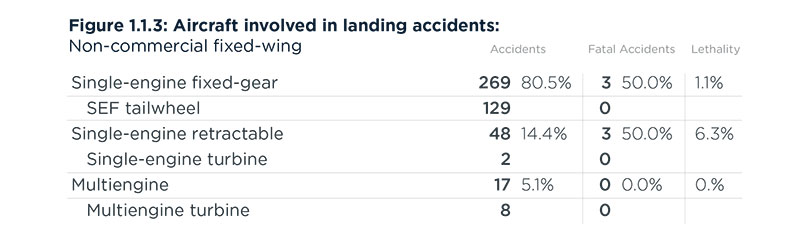
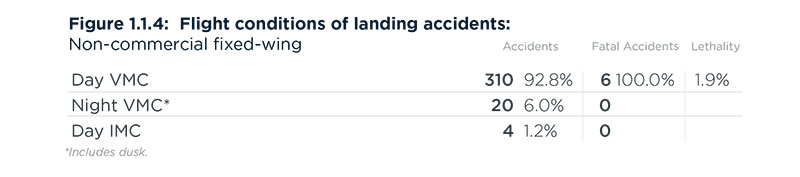
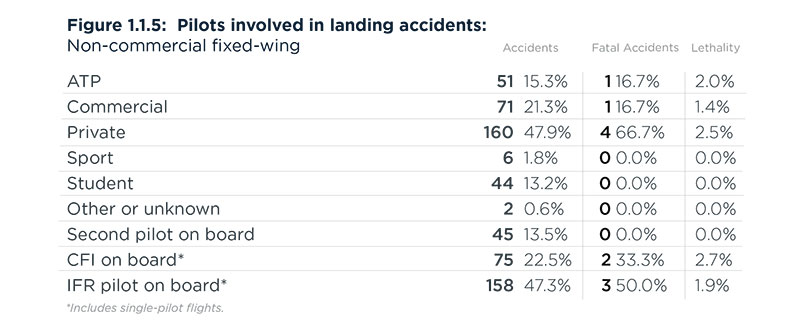
Landing accidents is again the largest “phase of flight” accident category increasing by 71 accidents from 2015 to 2016 (Figure 1.1.1). While landing accidents make up the largest category of pilot-related accidents, it has some of the fewest fatal accidents. Therefore, lethality of landing accidents is low. Loss of control was the single largest type of landing event at 156 accidents and 4 fatal accidents (Figure 1.1.2). The majority of landing accidents were flown in single-engine fixed-gear aircraft (Figure 1.1.3) during day VMC (Figure 1.1.4) by private pilots (Figure 1.1.5).
Other Pilot-Related Accidents
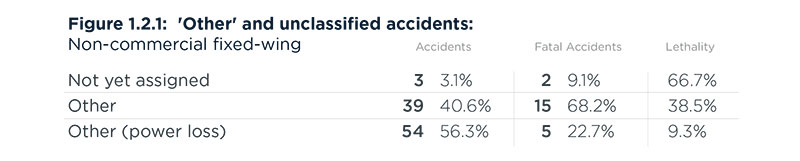
Accidents that could not be classified into a phase of flight, but were reasonably inferred based on preliminary data, fall into the other pilot-related accidents category. The majority of accidents (54) were power loss (Figure 1.2.1). Three accidents that remained unassigned along with 39 “other” accidents and unusual accidents—typically too small in number to bear their own category—are detailed in the list below:
- Crashed for undetermined reasons (8 accidents, 8 fatal)
- Bird strike (7 accidents, 1 fatal)
- Wildlife strike (6 accidents)
- Aircraft disappeared (4 accidents, 4 fatal)
- Unassigned (3 accidents)
- Hit by vehicle while on runway/taxiway (2 accidents)
- Parachute hit by aircraft (2 accidents, 1 fatal)
- Improper maintenance performed by pilot (2 accidents)
- Improper ATC procedure (1 accident)
- Fire due to undetermined reasons (1 accident)
- Passenger interfered with controls (1 accident)
- Banner entanglement (1 accident)
- Non-pilot crashed (1 accident)
Pilot incapacitation
- Suicide (3 accidents, 3 fatal)
- Drugs or alcohol (3 accidents, 2 fatal)
- Carbon monoxide poisoning (2 accidents, 2 fatal)
- Failure to use supplemental oxygen (2 accidents, 1 fatal)
Collisions
- Midair collisions (8 accidents, 7 fatal)
- On ground collisions (9 accidents)
Takeoff and Climb Accidents
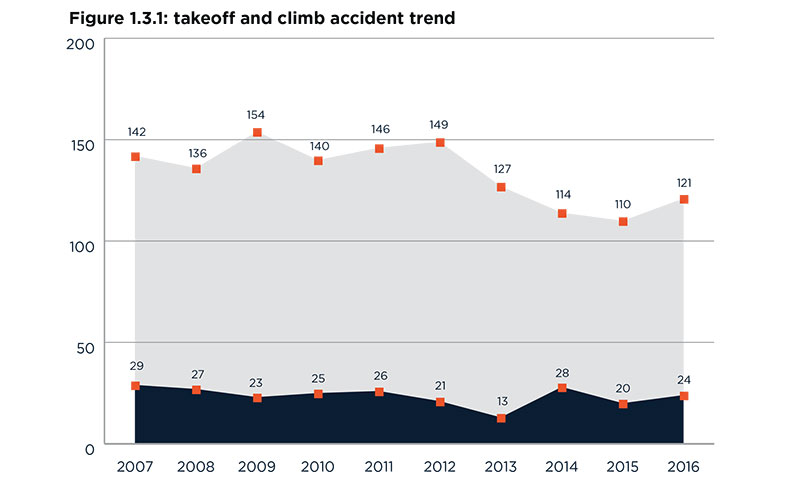
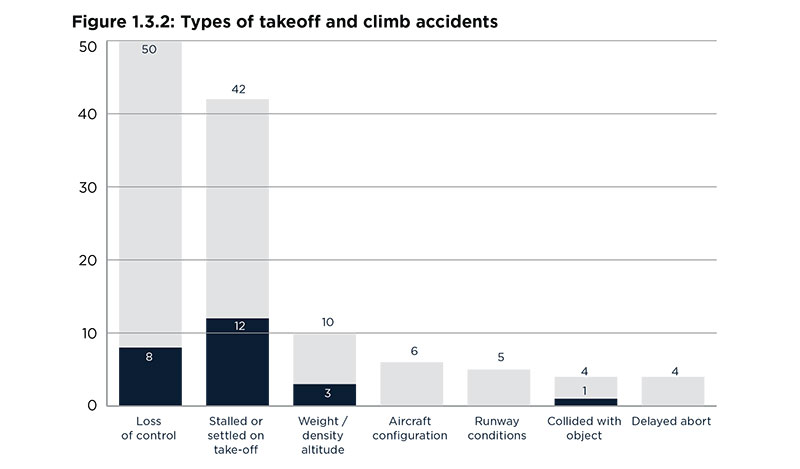
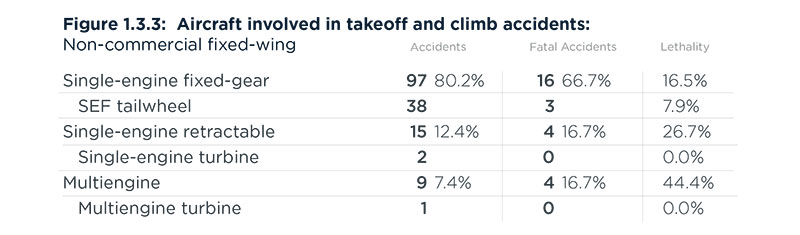
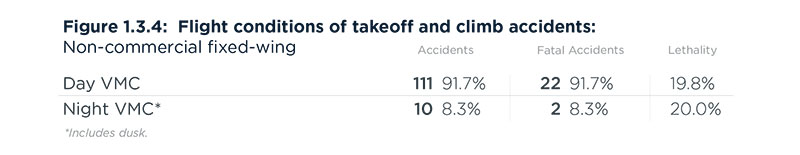
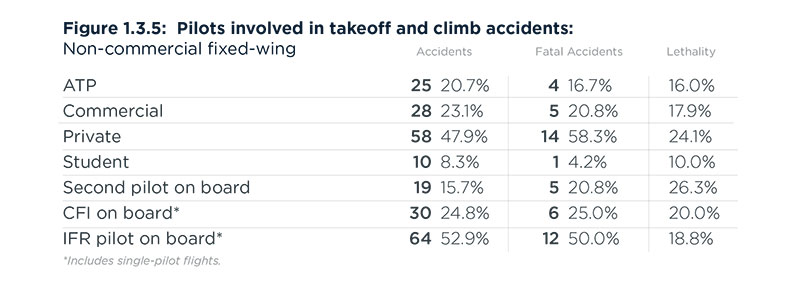
Takeoff and climb accidents increased for the first time in three years to 121 total accidents and 24 fatal accidents (Figure 1.3.1). Loss of control remained the largest event type with 50 accidents. Stalled or settled on takeoff had the second largest number of accidents and the highest number of fatal accidents at 42 and 12, respectively (Figure 1.3.2). The majority of takeoff and climb accidents were flown in single-engine fixed-gear aircraft (Figure 1.3.3) during day VMC (Figure 1.3.4) by private pilots (Figure 1.3.5).
Fuel Management Accidents
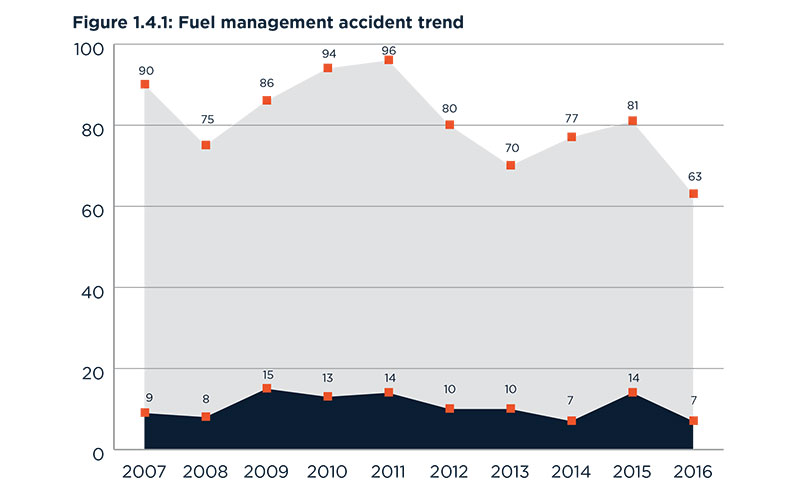
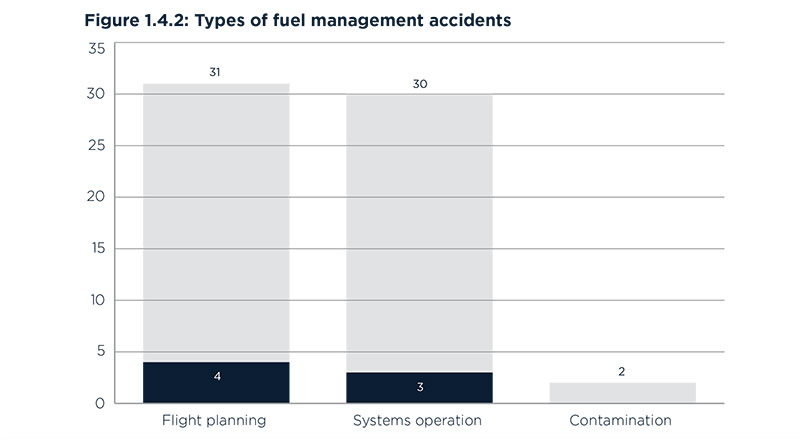
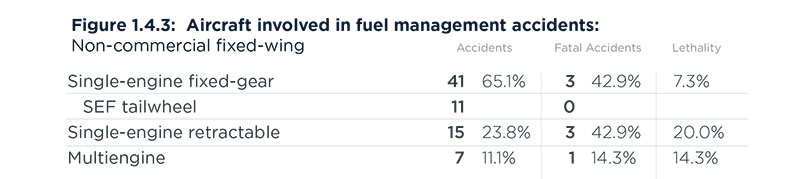
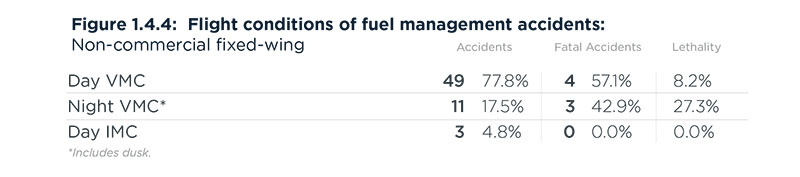
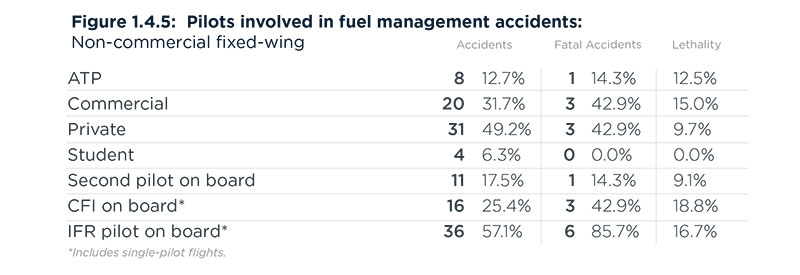
Fuel management saw a decline from 2015 to 2016 decreasing from 81 to 63 accidents. Fatal accidents declined during that same period from 14 to seven (Figure 1.4.1). Flight planning was once again the largest cause of fuel management accidents followed closely by systems operation (Figure 1.4.2). The majority of fuel management accidents were flown in single-engine fixed-gear aircraft (Figure 1.4.3) during day VMC (Figure 1.4.4) by private pilots (Figure 1.4.5).
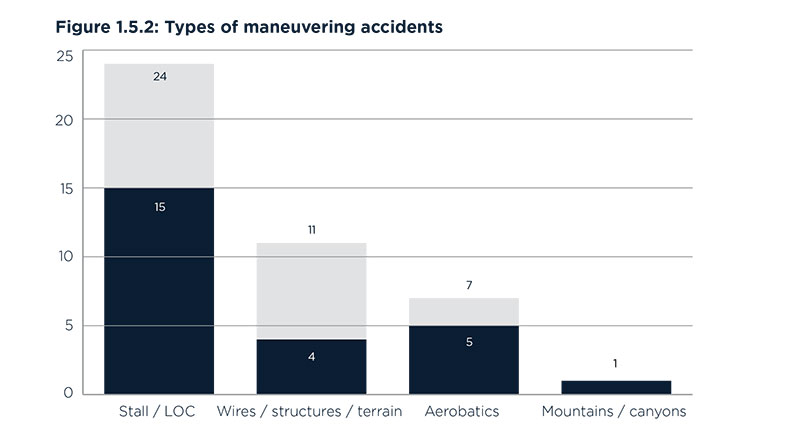
Maneuvering Accidents
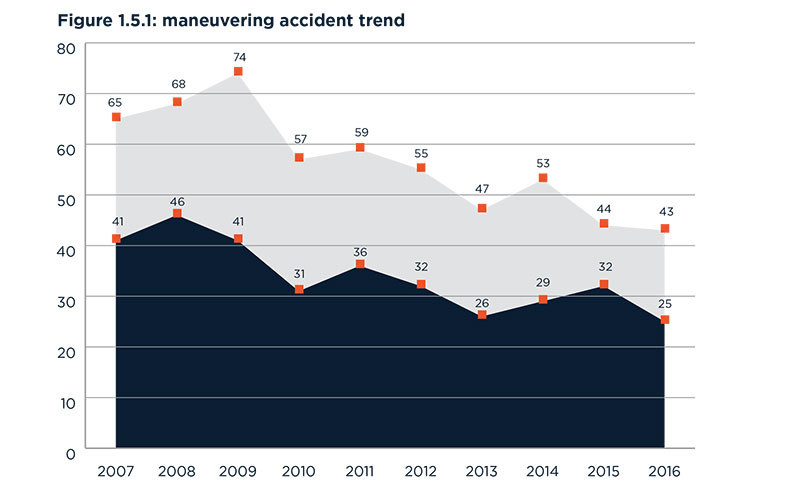
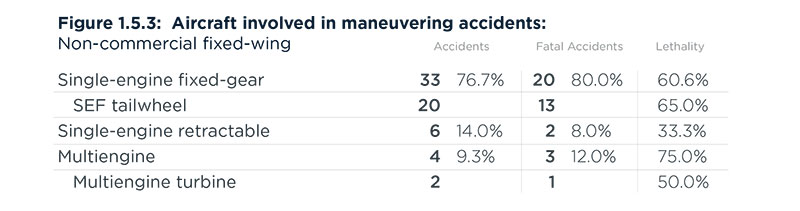
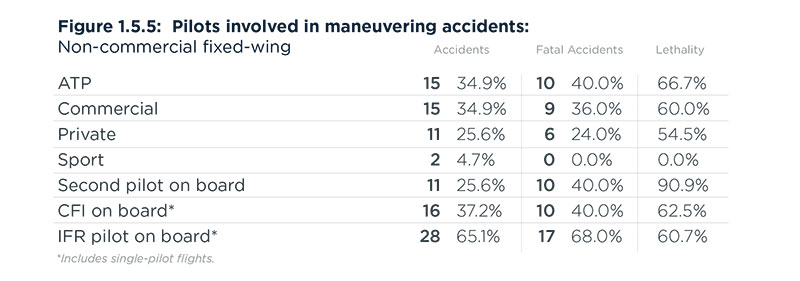
Maneuvering accidents decreased for the second straight year with 43 total accidents, with fatal accidents reaching a 10-year low at 25 (Figure 1.5.1). Stall / loss of control had 24 accidents, 15 of which were fatal (Figure 1.5.2). Aerobatics was the most lethal accident cause at 71 percent. The majority of maneuvering accidents were flown in single-engine fixed-gear aircraft (Figure 1.5.3) during day VMC (Figure 1.5.4) by pilots holding ATP and commercial certificates (Figure 1.5.5).

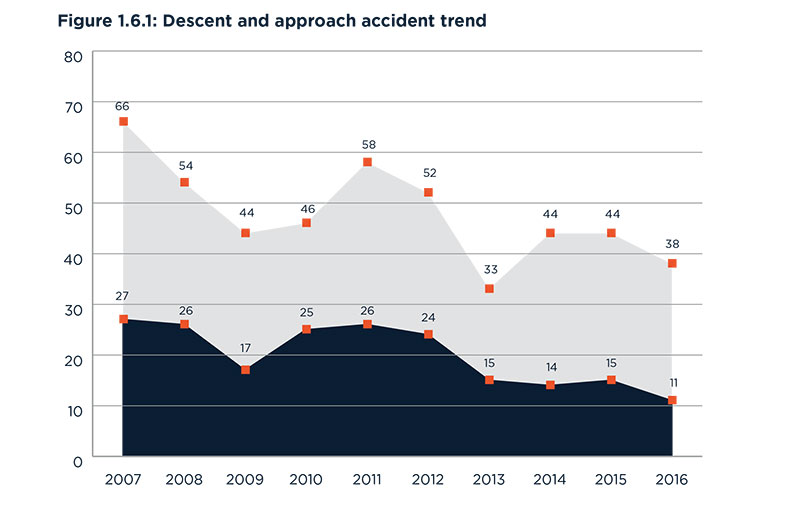
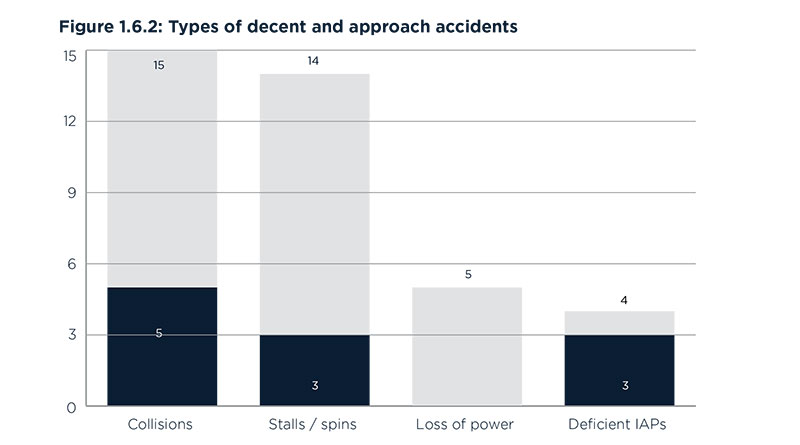
Descent and Approach Accidents
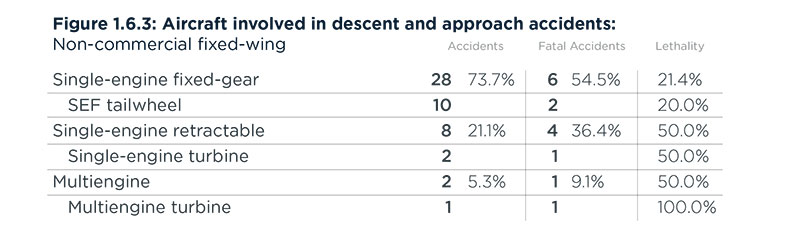
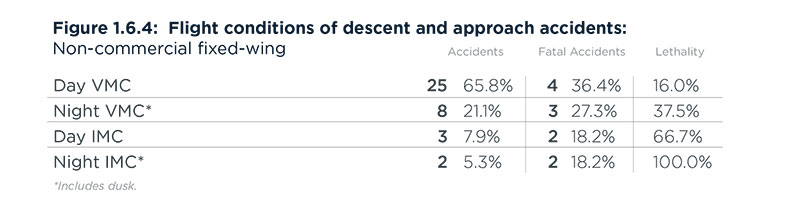
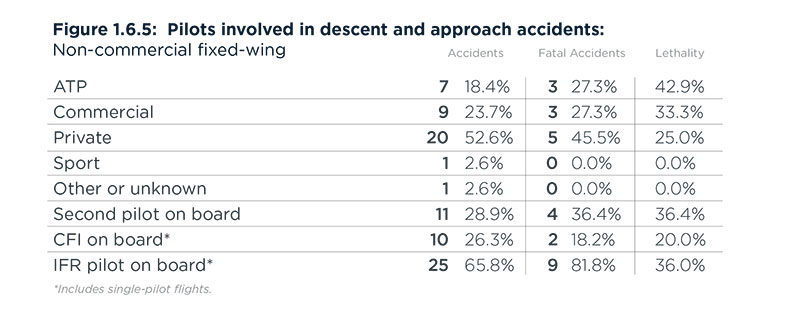
The descent/approach accident trend appears cyclical. Often there are years where a decrease in the number of accidents is evident. However, there are also years where the trend reverses itself and increases. Historically, there is a downward trend, but the year-to-year is subject to spikes. 2016 follows the downward trend with 38 accidents, 11 of which were fatal (Figure 1.6.1). Collisions is the largest cause followed closely by stalls/spins. Deficient instrument approach procedures (IAPs), was the most lethal with three of the four accidents being fatal (Figure 1.6.2). The majority of descent / approach accidents were flown in single-engine fixed-gear aircraft (Figure 1.6.3) during day VMC (Figure 1.6.4) by private pilots (Figure 1.6.5).
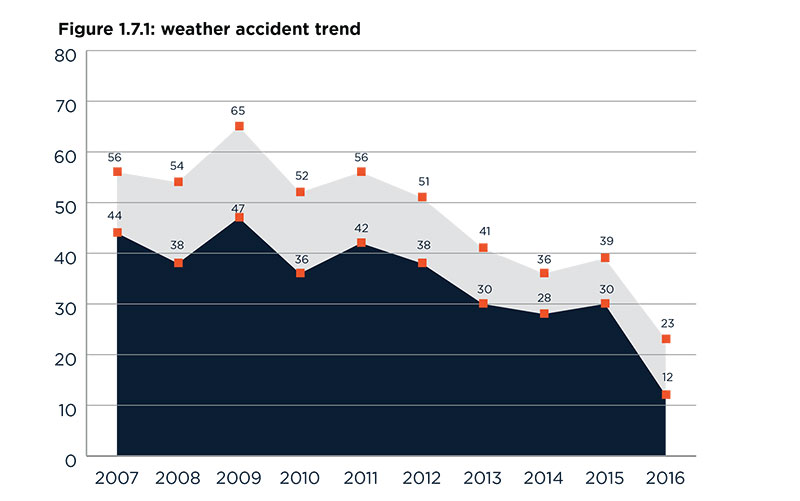
Weather Accidents
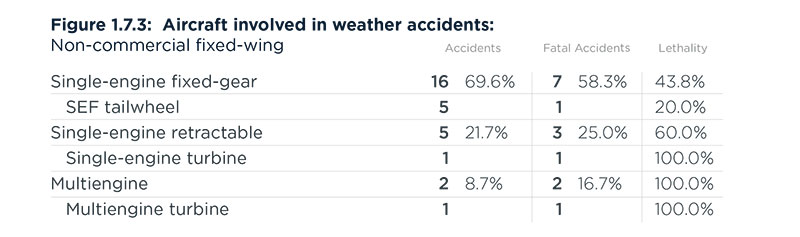
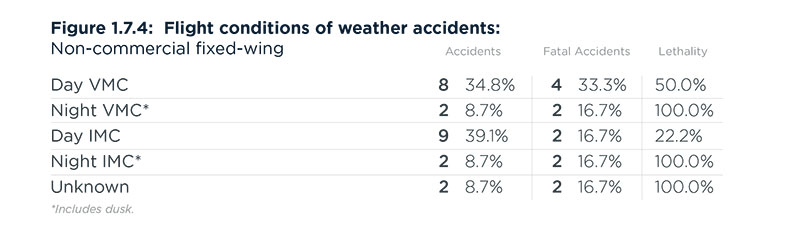
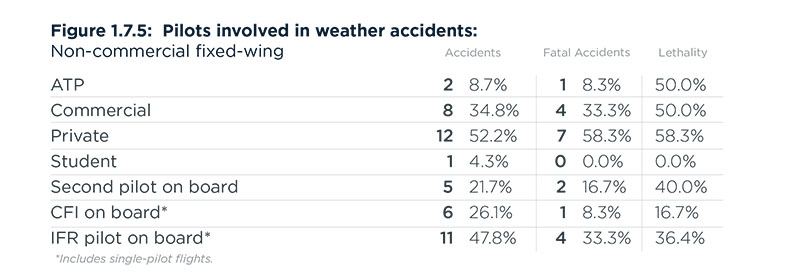
Weather accidents experienced a 10-year low with 23 total accidents and 12 fatal accidents (Figure 1.7.1). Visual flight rules into IMC was the leading cause of weather accidents. Poor IFR technique was the most lethal with all accidents being fatal (Figure 1.7.2). The majority of weather accidents were flown in single-engine fixed-gear aircraft (Figure 1.7.3) during day IMC (Figure 1.7.4) by private pilots (Figure 1.7.5).

Mechanical/maintenance
These accidents arose from mechanical failure of a component or an error in maintenance. Mechanical accidents account for roughly 18 percent of total accidents and 10 percent of fatal accidents. Compared to 2015, mechanical-related accidents suffered a two percent increase in both total and fatal accidents.
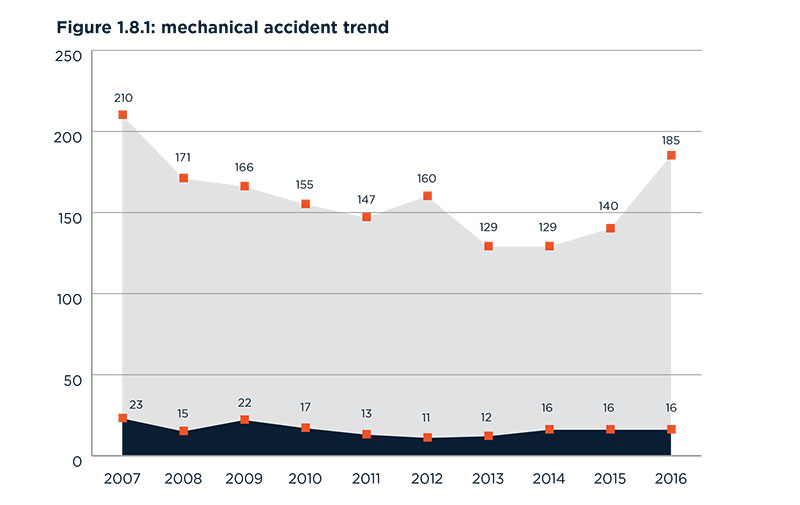
Mechanical Accidents
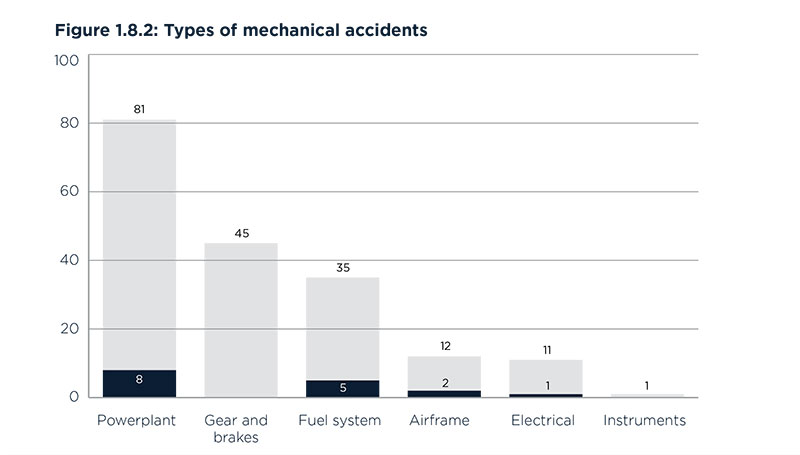
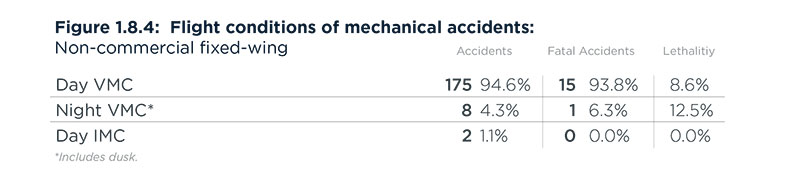
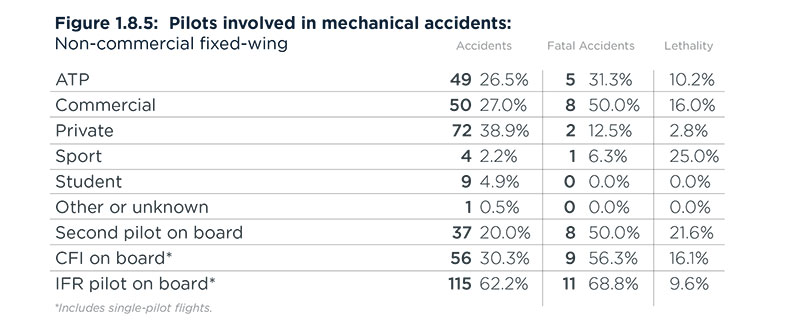
Mechanical accidents increased, again, in 2016 (Figure 1.8.1). The 2016 increase is cause for concern, particularly in light of the continuing advance in the average age of the GA fleet. Mechanical accidents are often the result of factors outside the pilot’s control. This does not remove the pilot from the responsibility of operating a safe and properly maintained aircraft, but it does indicate issues that may not be readily apparent or easily identified. Powerplant issues was the largest cause of mechanical accidents and fatal accidents (Figure 1.8.2). The majority of mechanical accidents were flown in single-engine fixed-gear aircraft (Figure 1.8.3) during day VMC (Figure 1.8.4) by private pilots (Figure 1.8.5).

Other/unknown
These accidents are for reasons such as bird strikes and unexplained losses of engine power, plus those for which a specific cause has not been determined. Other/unknown accidents accounted for nine percent of total accidents and 13 percent of fatal accidents.
While these numbers are following a long trend of data and appear consistent year to year, there is progress being made to reduce the types of pilot and mechanical-related accidents.