Weather Watch: Low pressure lowdown
The ‘typical’ surface low pressure system
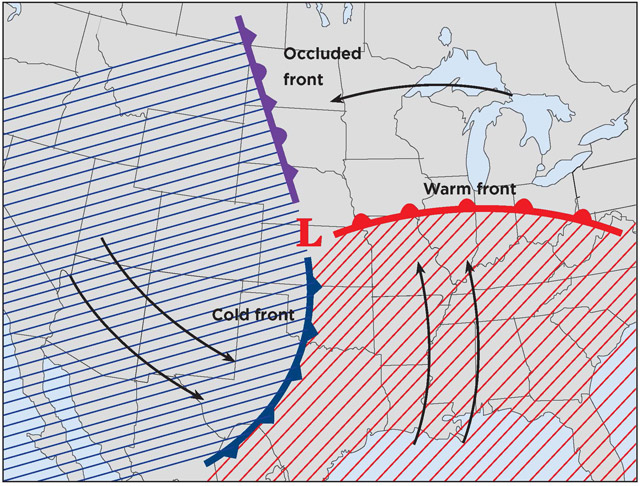
The classic low-pressure complex has a center of low pressure (the red capital “L”) with cold and warm fronts. The red and blue shadings represent the cold and warm sectors of the complex. The occluded front north of the low is the sign of a maturing system.
Pilots sometimes ask me what I think is the most important weather concept to understand. Wow, that’s a tough one.
I think they are referring to “big picture,” or synoptic-scale concepts, not the micro-scale elements of weather savvy—like the nuts and bolts of weather briefing strategies, interpreting forecast models, or understanding the nuances of radar imagery interpretation. But at the same time, I think they want this synoptic understanding to have relevance to day-to-day flying decisions.
There’s a lot to know, of course, but understanding the mid-latitude cyclone (low pressure) model is right up there for importance in my book. Think of this as understanding the mechanics of how surface low pressure centers and their fronts form and behave. Know this, and you have a good grasp of what to expect in the areas surrounding a low pressure complex. That’s saying a lot.
It all starts with a temperature boundary at the surface. It could even be a weak front, like a stationary front. There are always temperature discontinuities between northern states and more southerly ones, that’s just a fact of climatology. But for these boundaries to deepen into a low pressure center, the conditions aloft have to be just right.
The triggering mechanism is most often a trough aloft—a U-shaped pressure pattern that can be seen on constant pressure charts at the 500-millibar (about 18,000 feet) or 300-millibar (about 30,000 feet) constant pressure charts. As air flows around the bend at the apex of the “U” and then makes its way northeastward, some interesting things happen.
The upper atmosphere develops a counterclockwise spin, or vorticity, and the air downstream of this spin zone fans out in a divergent pattern. What does this mean at the surface? Well, if air is diverging aloft, the air at the surface must converge and rise. Add the spin from the vorticity and you have a low pressure center at the surface. Now the air masses around the surface low begin to rotate and collide with each other, creating cold and warm fronts. Presto—there’s your classic low pressure model. And it’s easily visible on a surface analysis chart.
At a glance, you can deduce the weather conditions within each sector of the model. The parent low, marked by a prominent “L,” has the lowest pressures, the strongest lifting forces, and therefore some of the worst weather.
To the south and southeast of the low is the warm sector. That’s where you’ll find the most unstable air, the warmest temperatures, highest humidities, and highest density altitudes. To the northwest of the typical low pressure model is the cold sector, with its colder air, highest pressures, and lower humidities.
Between the cold and warm sectors, of course, will be a cold front which marks the boundary between them. Being denser than the warmer air ahead of it, the cold front wedges its air beneath that warmer air, creating cumulus clouds and perhaps lines and clusters of thunderstorms.
To the north of the warm sector and east of the low pressure center is the warm front. Here, less-dense, warmer air rides up and over the colder air mass ahead of it. The result is widespread stratus clouds, elevated convection in the warmer months, and large swaths of icing conditions in the winter months.
After a few days, our typical frontal model loses its upper-air support. The low aloft draws the surface low away from the juncture of the surface cold and warm fronts, and a stretch of low pressure—an occlusion—extends to the north or northwest.
This extension is an occluded front, which is also well-known for creating adverse flying weather. Occlusions are signs that the surface low pressure system is dying. Soon, the surface low is detached from the one aloft, and all that’s left is the kind of benign, stationary temperature boundary that started the whole process to begin with.
That’s the life cycle, in a nutshell. All surface low pressure systems and fronts aren’t the same, of course, but this description fills the bill for many of them. See a trough aloft heading east? See surface pressures dropping ahead of it? It shouldn’t be a surprise to see what happens over the next few days.
Email [email protected]
AOPA Wx Watch coverage sponsored by DTC Duats
Weather words
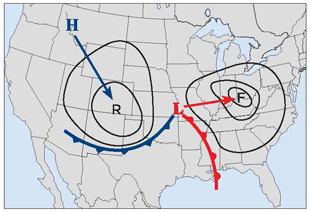
Isallobars. These are lines of equal surface pressure change. Forecasters locate stations having rising or falling barometric/altimeter values in order to see where low pressure is forming—and where low pressure centers are likely to move. Not surprisingly, lows move to locations where surface pressures are already falling. Here’s a chart with isallobars showing the idea, with “R” signifying rising pressures, and “F” indicating falling pressures.
Related Articles


