WX Watch: Views from orbit
Insights from GOES’ ‘big three’

The National Oceanic and Atmospheric Administration’s two GOES (Geostationary Operational Environmental Satellites) satellites give us stunning views from their equatorial perches some 22,300 nautical miles above the Earth’s surface. At that geostationary orbit, the satellites are traveling at the same speed at which the Earth rotates, so they seem to hover over the same location, allowing us to study the features below pretty much 24 hours a day. Right now, we have two GOES satellites. GOES-16 is stationed at a longitude of 75.2 degrees west; it watches over the eastern portions of North America. GOES-17 is at 137.2 degrees west longitude and looks over the western portions. However, both satellites have coverage ranges that extend well beyond the United States.

Visible channel
Of the “big three” GOES products, the visible channel is the most intuitive because it mimics our vision. It shows reflected light, and the higher the albedo—whiteness—of the light reflected back to the satellite, the brighter the picture. The densest cloud formations are the brightest, and the visible imagery’s clarity lets us examine the growth of convective clouds, the overshooting tops of severe storms, the cloud streets downwind of mountainous terrain, the popcorn shapes of fair-weather cumulus, the shapes and coverages of frontal clouds, the cirrus clouds that can precede frontal activity, and much more.
Visible imagery has some drawbacks. Because the albedo of fog and low stratus clouds is comparatively low, the channel doesn’t register it as well. On clear days in the colder months, the brightness of snow on the ground can trick you into thinking you’re seeing clouds. Look for the dark outlines of lakes or rivers to help confirm snow cover. Another way to sort out the ground from any clouds is to loop the visible channel. Clouds move, but the ground doesn’t.
Of course, visible imagery has one vaulting drawback: You can’t see it at night. When the sun goes down, so does any reflected light. However, the low sun angles at sunrise and sunset can cast impressive shadows that help define cumulonimbus and other large cloud formations.
Water vapor channel
The water vapor channel is tuned to shorter wavelengths, in the 6-7-micron radiation band. That’s where water vapor is very effective at absorbing and emitting energy, and that’s what the satellite’s radiometer picks up on. True, water vapor exists everywhere in the atmosphere, from the surface to the highest levels. At the surface, because of gravity and emissions from the ground, water vapor has a high concentration. But it drops quickly with altitude.
I know most pilots love to check out GOES imagery before any long flight, so what’s your strategy to combine the “big three” strengths in a briefing?The satellite picks up water vapor emissions at altitudes in the 15,000 to 25,000-foot level—far above the lessening concentrations below, and far below the even lower concentrations at altitudes deep in the drier flight levels. This explains water vapor imagery’s drawback: It ignores the signatures of any clouds or water vapor below. You could see a visible satellite image showing low cloud layers, yet see the dark signature of dry air on water vapor imagery in the same area.
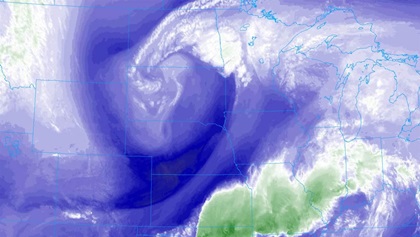
On water vapor imagery, denser concentrations of water vapor show up as white or gray, while drier air can be depicted in black—or blue or yellow—shades. (The College of DuPage shows customized images of water vapor at both upper and lower levels.)
So, what’s the use of water vapor imagery? It’s an indicator of moisture patterns aloft, and it can clearly show the circulations around low pressure centers and fronts. For example, the “clear slot”—a band of dry air that trails a cold front—can easily be identified as a dark wedge. Another advantage is that the water vapor channel works both day and night, and animating it can serve as a 24/7 proxy for tracking the movement of any synoptic-scale weather.
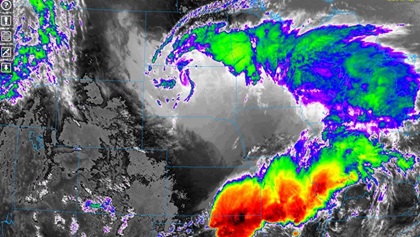
Infrared channel
Infrared imagery is calibrated to temperature; you’ll see a temperature scale along the lower edge of its frame. It’s useful for determining the highest cloud tops: The colder the clouds, the higher the tops. The brightest colors or shades are for the colder temperatures. Match the colors on the image with the colors on the temperature scale for a more precise measurement. Infrared is great for identifying the highest tops associated with the more severe thunderstorms.
It’s not so good at detecting low clouds and fog, because the radiating temperatures of the clouds and fog can be the same as those of the nearby ground. In the colder months, the satellite can average the radiation from any thin cloud layers with the ground temperature, showing the tops lower and warmer than they really are.
Its saving grace is that, unlike imagery in the visible spectrum, infrared works at night, and can be a trusty substitute. That’s probably the reason the Aviation Weather Center (AWC) website uses infrared imagery as its default view on its homepage. (The AWC also has a “Vis/Fog” product that compensates for traditional infrared’s blindness to low clouds by using different channels to highlight low clouds as brighter, and high clouds in darker shades.)
I know most pilots love to check out GOES imagery before any long flight, so what’s your strategy to combine the “big three” strengths in a briefing? Visible imagery will tell you—during daytime!—if any clouds are dense and loaded with moisture, or thin and less apt to produce precipitation. Water vapor imagery shows the speed, movement, and energy of moisture flows—and reveals any motions not apparent on other images. Infrared gives an idea of the height of any cloud formations.

Related Articles


