Get extra lift from AOPA. Start your free membership trial today! Click here

Far-out forecasts

Getting a sense of the weather—14 days from now

For most of us, traditional weather forecast products serve well when it comes to short-term planning. We know what to check for a flight today or tomorrow, and most of the information is in one place—on the Aviation Weather Center website.
Far-out forecasts

  To learn about initial conditions, we have hourly metars at many airports. Terminal aerodrome forecasts (TAFs) are issued four times a day and give forecasts 24 hours into the future, as do winds and temperature aloft forecasts, forecast icing potential (FIP) guidance, and surface-to-Flight Level 240 prog charts. Aviation surface forecasts show surface features up to 18 hours out. The graphical forecast for aviationn(GFA) tool is even more helpful in identifying—or avoiding—instrument meteorological conditions and other adverse weather, and it predicts 18 hours into the future as well. For longer-range guidance, convective outlooks from the Storm Prediction Center (spc.noaa.gov) go out as far as eight days, and the Weather Prediction Center’s projected surface analyses (ncep.noaa.gov) give seven days’ worth of charts. Meanwhile, those who use ForeFlight can take a look three days in the future by clicking on the “MOS” link under the Weather tab on an airport page. MOS (Model Output Statistics) usually appears in a coded, text format but ForeFlight provides plain-language TAF-style summaries. The nice thing about ForeFlight’s MOS is that they’re provided for airports that may not be served by TAFs.

Pivotal Weather website can show many forecast models, and the one here is the GFS model with “composite reflectivity” selected from the menu at the lower left. With the model initialized at 12Z on April 13, clicking on the 246-hour forecast time gives you a view of what the precipitation situation might be 10 days in the future, on April 23 at 18Z. No way is this a bulletproof forecast, but it’s a starting point for comparisons with future updates as the target day draws near. Clicking on other parameters listed on the menu gives you other variables, like temperature, dew point, surface pressure.

But what if you’re planning for a trip three,five, or more days away? Are there ways of gaining a sense of what’s in store? Are conditions trending toward severe-clear, or is a moisture-laden frontal system taking aim on your destination? TAFs can’t tell you, nor can the progs, aviation surface forecasts, or the GFA tool. And the WPC’s forecast surface analysis charts begin to drop precipitation symbols after two days out, leaving the next five days’ chart with fronts, highs, and lows only.

Here’s where numerical weather prediction—computer-generated forecast models—can provide an extra dimension of long-range planning. You won’t find them on the AWC website, but they thrive on the internet. These models crunch all manner of atmospheric data—wind flow patterns, thermodynamics, climatological factors, remote sensing from weather balloons and satellites, and much, much more—and can come up with graphic representations of surface and upper-air patterns, temperatures, moisture contents, instability indices, and even cloud layers. In the case of one forecast model—the Global Forecast System, or GFS—information like this is presented at three-hour intervals up to 14 days in advance.
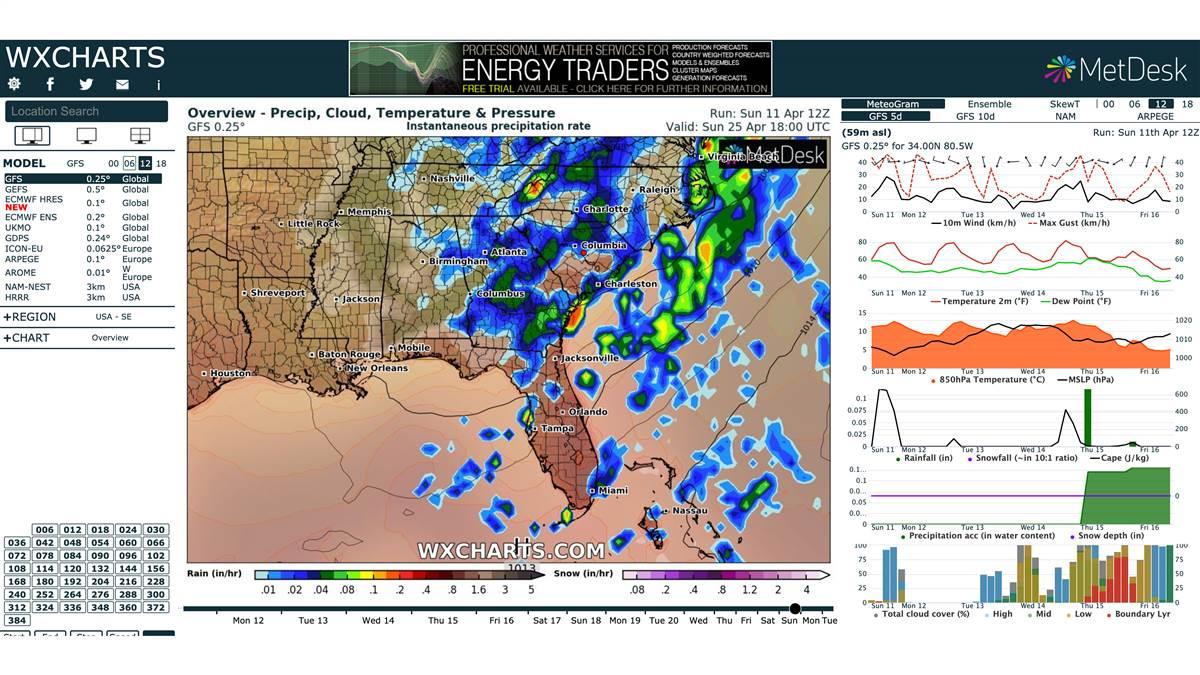
The WX Charts website depicts GFS model output, showing an overview of conditions seven days in the future, with a valid time of April 25 at 18Z. Click on the “+CHART” link at left to select other weather variables. By clicking on a place of interest on the map, you can call up a meteogram in the split-screen view, which shows conditions expected five days in the future. We clicked on Columbia, South Carolina (red dot). Wx Charts can also show conditions in other regions and nations—click on the “+REGION” link from the menu on the left side of the page.

There are dozens of forecast models out there, but most of them aren’t as long-legged as the GFS. The NAM (North American Mesoscale) goes out three days, for example, and the RUC (Rapid Update Cycle) only projects two days out. So, it’s worthwhile for pilots who want a long view to shake hands with the GFS’ products and presentations. At the same time, let’s bear in mind that forecast accuracy declines with time. Forecasts for five days out can be accurate, but nobody should bet on any forecast longer than that. Still, it can be interesting to keep checking each day in the forecast cycle to see if the model stays somewhat true to its original guidance, or if it’s changeable and takes different directions.

Models generally observe certain conventions. They tell when each model run has been initialized (the GFS is updated every six hours) and identify the valid time for the model products. You’ll see this information at the top or bottom border of a forecast product image. The most recent model run, of course, will give the more accurate information. For example, on one corner you might see “Cloud Cover, Total (%)” and beneath it something like “F93 Valid: Thu 2021-03-25 09Z,” and in another corner “Init: Sun 2021-03-21 12Z GFS.” Translated, this means that the image you’re looking at is a 93-hour forecast valid for March 25, 2021, at 09Z, and that the model was initialized on Sunday March 21, 2021, at 12Z. To select a certain valid time there’s often either a cluster of buttons with valid times in each, a time-slider (like the one in the GFA Tool), a mouseover feature, or a loop capability that lets you animate the forecast.
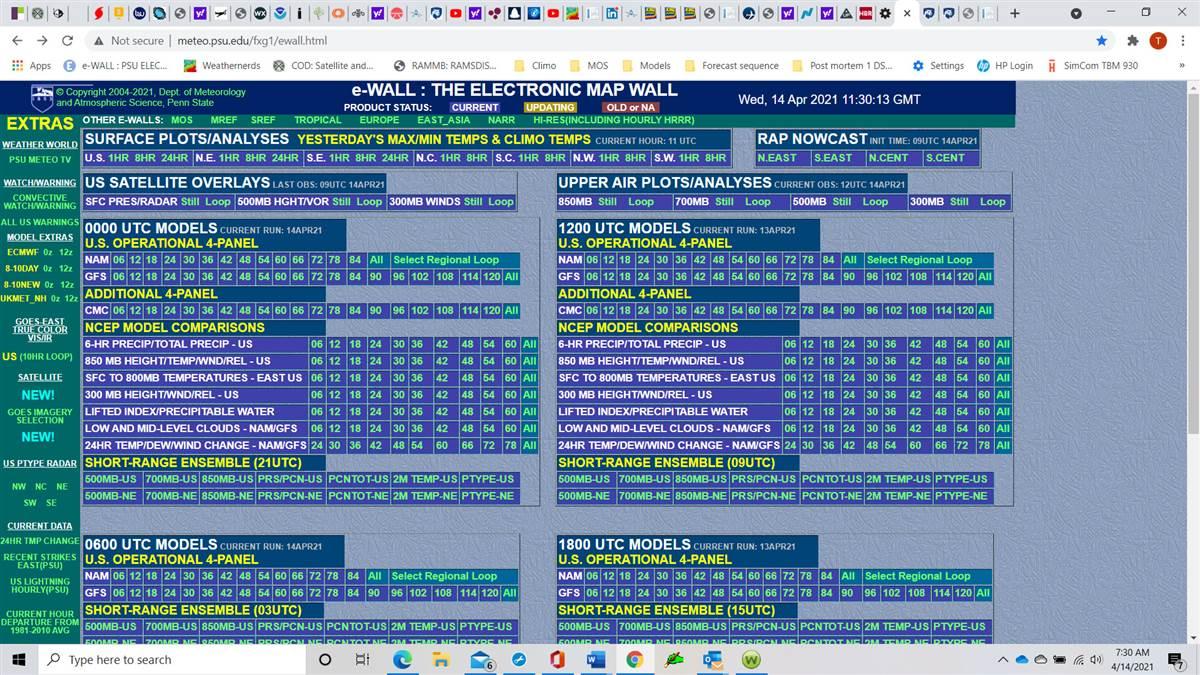
Penn State University's "E-Wall" is a jumble of products—but it can be one-stop shopping for meteorologists. Click on a forecast time in the NAM and GFS rows under the 0000-UTC and 1200-UTC Models headers to call up forecasts. Or click on the “All” buttons and mouse over the forecast times at the top of the forecast products (next image) to animate changing conditions. The six-panel GFS product below shows anticipated conditions 14 days in the future.

I often use WxCharts, Pivotal Weather, and Penn State e-Wall websites to look at models, including the GFS. WxCharts (wxcharts.com) lets you call up a meteogram or Skew-T chart from four other models at the same time you scope out the main image for things such as precipitation, 10-meter wind, wind gusts, or temperature. Pivotal weather (pivotalweather.com) lists products down the left side of the page, including radar views of composite reflectivity. Again, a reminder: Don’t bank on this “future radar.” You won’t see reliable radar depictions until the day of your flight, but it’s intriguing to see a supercomputer’s idea of precipitation contours several days in the future. Oh, and click anywhere on a chart and up pops a Skew-T, Log-P chart.

Far-out forecast

The Penn State e-Wall’s homepage (meteo.psu.edu) is a chaotic blizzard of links, but start out by focusing on the headers labeled 0000Z and 1200Z Models. That’s where the GFS and NAM models reside. Click on the forecast-hour buttons for single snapshots, or All to see the models’ full runs. The e-Wall gives views of six panels, and one of them predicts areas of low (below 6,000 feet), mid-level (6,000 to 24,000 feet), and high (above 24,000 feet) cloud layers.
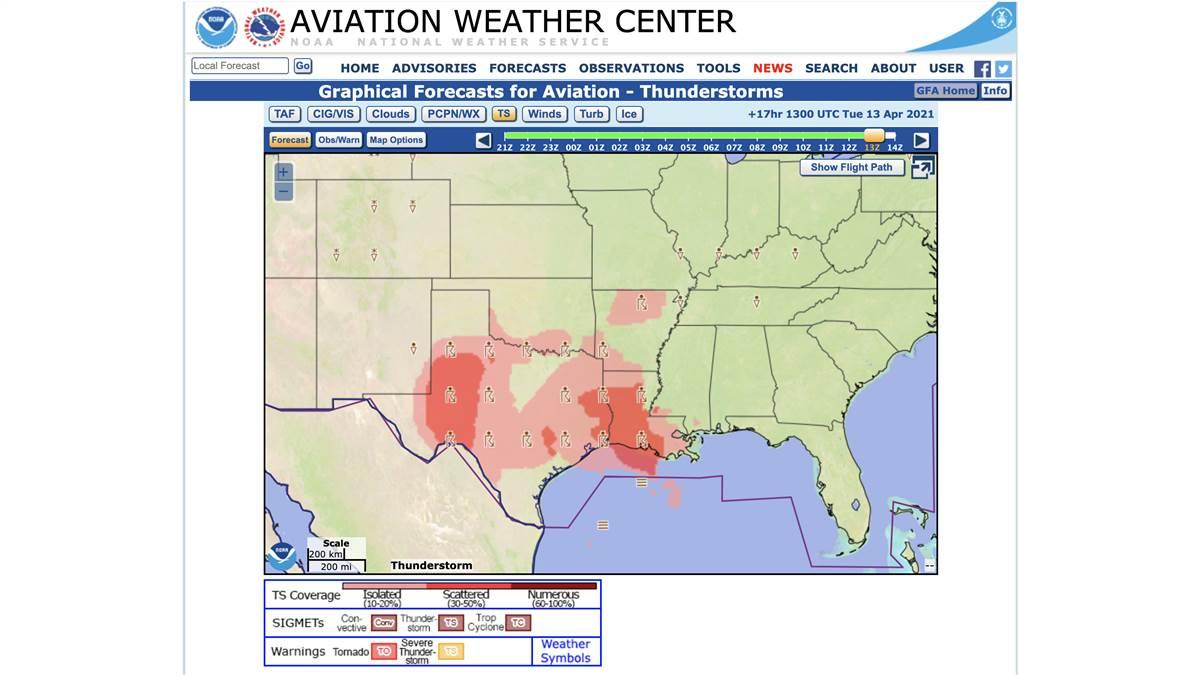
Aviation Weather Center's GFA tool looks up to 18 hours in the future. It effectively replaced the area forecasts of yore. Click on the hazard buttons at top, then use the time-slider to pick your forecast time of interest. Here, thunderstorm coverage areas are depicted for 13Z.

Each website has links that can take you to other weather products. For the most part, navigating them is intuitive, as are their images (with a little effort) and map legends. Click around and explore and you’ll be a pro in no time. You might find yourself checking out the models as part of your briefing routine. After all, FAR 91.103 isn’t specific about sources of preflight weather information. It merely says that pilots must “become familiar with all available information concerning that flight.” For flights under IFR and not in the vicinity of an airport, the regs paint with the vaguest of strokes by saying that the information must include “weather reports and forecasts.” I’m assuming that forecast models fit that description—especially if you’ve been watching them for days.

Email [email protected]

Thomas A. Horne

Thomas A. Horne

AOPA Pilot Editor at Large
AOPA Pilot Editor at Large Tom Horne has worked at AOPA since the early 1980s. He began flying in 1975 and has an airline transport pilot and flight instructor certificates. He’s flown everything from ultralights to Gulfstreams and ferried numerous piston airplanes across the Atlantic.

Related Articles