WX Watch: Storm Vision
What scary looks like

 Storm Prediction Center
(www.spc.noaa.gov)
You say you’re planning on flying tomorrow or the day after that? Then check out the SPC’s Convective Outlooks. The Day One (today) and Day Two (tomorrow) outlooks are pretty accurate. Some outlook maps go out four to eight days in the future—but as you might suspect, long-range accuracy is less reliable. The SPC dwells on the likelihood of severe thunderstorms (those with 75-mph/65-knot winds, hail greater than two inches in diameter, or tornadoes capable of lifting cars off the ground) but they also cover “general” thunderstorms, which are bad enough by themselves. The SPC’s Thunderstorm Outlooks cover probabilities for four- or eight-hour predictive time frames. The probabilities are 10, 40, or 70 percent.
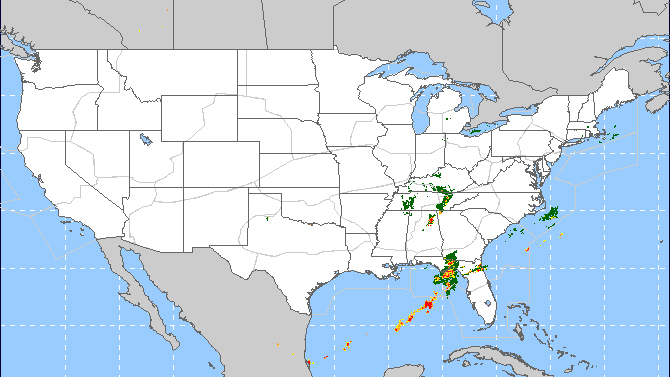
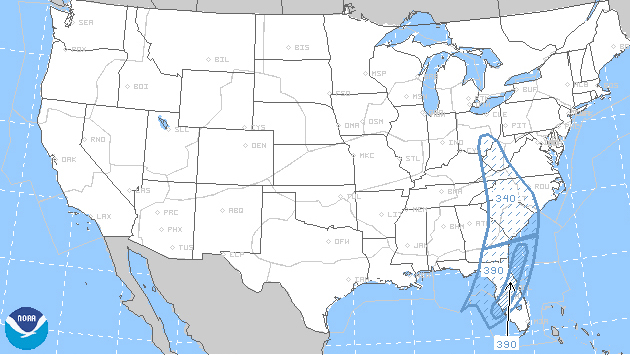 The Aviation Weather Center’s convection pages
(www.aviationweather.gov/convection)
Here you can find several interesting renditions of future convection. The National Convective Weather Forecast (NCWF) plots show the current day’s observed and forecast areas of storms at five-minute intervals. This lets you see where storms are expected to pop up, as well as where they’re forecast to move. The Extended Convective Forecast Plot (ECFP) shows forecast areas for the next 72 hours, along with three levels of probability: 40 to 59 percent; 60 to 79 percent; and more than 80 percent. Together with the SPC’s outlooks, the ECFP can give you a good idea if trouble is in the works for that weekend trip. The Traffic Flow Management (TFM) page is intended to keep air traffic control advised of any high-confidence, strong convection (echo tops above 25,000 feet, radar reflectivity of 40 dBz or higher) with coverage areas that could influence traffic routing.
Ohio State University’s Twister page for CAPE
(http://twister.sbs.ohio-state.edu)
Want to get more technical? Have a look at the Convective Available Potential Energy (CAPE) values on this site’s “models” dropdown menu. Then click on “all charts,” and scroll down to the CAPE entries. These are updated four times a day. CAPE shows those areas with the most moisture-laden air masses and the best potential for lifting.
 The model Ohio State uses (the NAM, or North American Mesoscale) gives forecast CAPE values that extend as far as 84 hours in the future. There are values for convective inhibition (CIN) also, but this involves air that prevents rising motions, and we can skip a CIN lecture for now. We want to see where the action is, so click on a forecast hour along the red bar at the bottom of the chart to see the CAPE maps, and note the valid forecast time stamp at the bottom of the posted chart. Look at the information appearing to the right of “Valid,” after which the year, month, and date appear, along with a time value. For example, an entry might say the following: “Valid: MON 170522/0900V003.” Translated: The CAPE forecast is valid on Monday, May 22, 2017, at 0900 Z, which is a three-hour look into the future (V003) from the model’s initial run time of 0600 Z. See CAPE values above 1,500? Better check those areas on other forecast charts for convection. Above 2,500 or 3,000? Uh, oh. Things are looking like they might be more serious. CAPE values, by the way, are given in joules per kilogram (j/Kg), which sounds like something from an electrical engineering textbook—but, hey, this is meteorology’s way of indicating potential energy in the atmosphere.
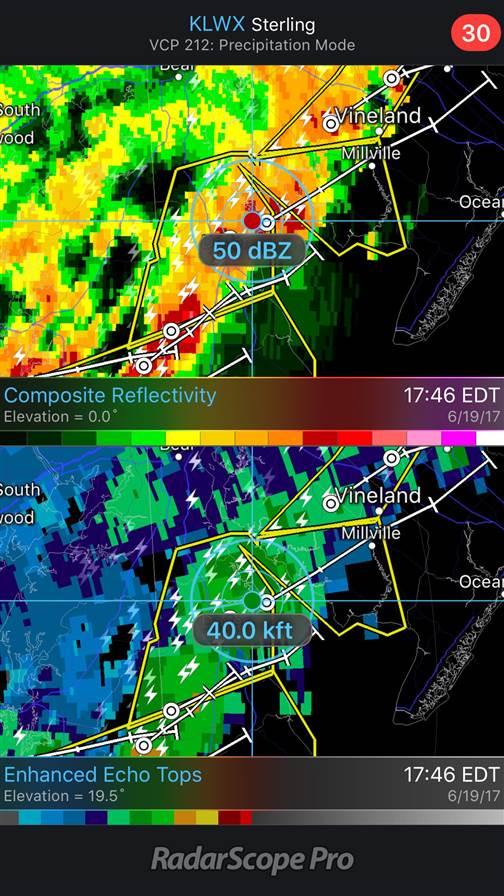
Radarscope Pro
Radarscope Pro is an app—one of many weather apps living in the app store, but one which is especially interesting for storm analysis. It shows radar imagery, sure, but you can see many other characteristics of a storm system, too—such as signs of a tornado’s rotation, cloud-top heights, direction of cell movement, amount of moisture in clouds, rainfall rates, precipitation types, watch and warning boxes, and more. You can even split the screen view to observe two different variables within a single zone—using a crosshair-style reticle you can scoot around the screen. And of course, your surface location also is visible. Radarscope Pro is $9.99, but it’s worth it.
Many other sources of convective information are out there, and we don’t want to diminish their importance. After all, most are quite comprehensive—and this includes the trusty, old in-person telephone call to a flight service specialist. But these are some go-to sites for tiny slices of quick-access preflight information aimed specifically at convection.
Email [email protected]

Related Articles


